
I. Introduction
Litigators often spend significant time preparing and drafting briefs. But does this focus on the written word significantly affect judges’ decisions? There is a dearth of empirical evidence available to answer this question. This Article is one of the first to use lawyers’ written work to measure the statistical relationship between brief readability and case outcomes.[1] It is the only article to do so at the trial court level, where the vast majority of lawyers practice. The Article is also the first to measure the readability of each brief in relation to its opposing brief in the same case, rather than measuring readability in the abstract as in prior studies. After controlling for attorney experience, law firm size, and the lawyer’s status as a repeat player before the motion judge, this Article finds a statistically significant relationship between brief readability and the outcome of summary judgment motions. It also finds that readability has a stronger relationship to summary judgment success in federal courts than in state courts.[2] After several earlier studies of appellate brief quality and success on appeal yielded conflicting results, our finding paves the way for additional research.
On the academic side, effective legal writing is the subject of scores of legal writing textbooks[3] and hundreds of articles.[4] Legal writing instruction has been part of legal education in some form since the time of Langdell.[5] The American Bar Association’s law school accreditation standards recognize the importance of legal writing by requiring law students to undertake writing experiences as part of their first-year and upper-level courses.[6]
Judges and practitioners also emphasize the need for effective legal writing. In a series of interviews with legal writing expert Bryan Garner, Supreme Court Justices affirmed the importance of briefs to the appellate process and the need for lawyers to write clearly.[7] In a recent study, Judge Richard Posner found that judges view writing as equally if not more important than oral advocacy.[8] Continuing legal education programs offered by state bar associations frequently address the need for effective legal writing.[9] No one disputes that lawyers should write well.[10]
Despite this consensus on writing’s importance, little empirical evidence suggests that “good” brief writing actually makes a difference.[11] Proving this proposition is difficult for at least two reasons. First, judges may be reluctant to suggest that the quality of a lawyer’s writing can influence the outcome of a case. Such a claim would conflict with the notion that judges resolve cases based on the facts and law, rather than on the advocate’s quality.[12] Second, assessing writing quality is difficult because it can be both time-consuming and subjective.
Still, some studies have asked judges, lawyers, and professors to report their subjective assessment of good and bad writing samples. For example, Kenneth Chestek found that judges, law clerks, and practicing lawyers rated sample briefs with strong narrative components as more persuasive than sample briefs without strong narrative components.[13] Sean Flammer found that judges rated sample briefs as more persuasive when they were written in plain language rather than in legalese.[14] Similarly, Robert Benson and Joan Kessler found that appellate judges and their law clerks preferred briefs written in plain language rather than in legalese.[15] Finally, Joseph Kimble and Steve Harrington found that judges and attorneys preferred plain language over legalese.[16] These studies, however, measure only the judges’ and lawyers’ stated preferences for particular styles of writing. They do not claim a positive association between more readable briefs and favorable case outcomes.
To date, only three studies have used empirical methods to test the hypothesis that more readable brief writing is positively associated with favorable outcomes. Two found a statistically significant association between readability and favorable outcomes; the third did not.[17] Those studies, however, analyzed brief writing in the appellate courts, where the factual record has been fully developed and the legal issues have been vetted below. These features of appellate court work may blunt any effect of brief readability on case outcome.
Finding a positive association between brief readability and case outcome would be important for three reasons. First, a positive association would reinforce the importance of legal writing instruction in law school and in continuing legal education.[18] Second, a positive association would help further motivate law students and lawyers to strive for effective writing, which in turn could help the court system function more efficiently. Finally, a positive association would point the way toward further study of the causes behind that association and thereby inform how practicing lawyers approach brief writing.
This Article explores the association between readability and favorable outcomes on summary judgment motions. Because attorneys file summary judgment motions in state and in federal courts, we also test whether there is a differential impact of readability on judges’ decisions in these two sets of courts. The Article focuses solely on summary judgment motions because they offer two easily measured outcomes (motion granted and motion denied) and because judges must confront these motions in a large cross-section of trial court cases. The Article addresses the following two hypotheses:
Hypothesis 1: Increased brief readability will lead to a greater likelihood that a party will prevail on a motion for summary judgment.
Hypothesis 2: When the moving party’s brief is more readable than the non-moving party’s brief, the moving party will be more likely to prevail on a motion for summary judgment.
In the next section, we detail our theoretical framework and describe why brief readability may affect decisions on summary judgment. We then review our methodology, including how we measure brief readability. The subsequent section examines results in both federal and state courts and analyzes what might explain differences between judges’ decisions in these courts. After describing our findings, we discuss their implications for practitioners and suggest avenues for further research on the effects of brief readability.
II. Piecing Together Readability and Judicial Decision-Making
This section first describes the cognitive theory that explains how readability might affect decision making. Next, this section describes the evolution of quantitative approaches to measuring readability. Finally, this section surveys the existing research on the correlation between readability and case outcomes.
A. Cognitive Theory and Readability
Why might readability matter? Drawing on cognitive psychology, Julie Baker summarized the role of “fluency” in human information processing.[19] Cognitive theory recognizes two different information processing systems that our brains employ. The “associative system” compares new stimuli to what we know about the world, and often manifests in “quick, automatic reasoning decisions based on inferences.”[20] The “rule-based” or analytic system allows for conscious consideration of stimuli in decision-making situations, and often manifests in a more deliberate reasoning process.[21] “Fluency” refers to the relative ease or difficulty of a cognitive process, and fluency helps determine which information processing system we use. Where information is fluent, readers will be more likely to use the associative system; where information is disfluent, readers will be more likely to use the rule-based or analytic system.[22] In written materials, fluency can be influenced by aspects of formatting and presentation such as font, color, and spacing.[23] Fluency is also a function of readability-related characteristics such as sentence length and complexity, vocabulary, and grammar.[24]
Studies from a variety of disciplines show that greater readability can influence readers’ behavior or comprehension.[25] Several studies addressed readability in the context of investments and corporate disclosures. Lehavey et al. found that less-readable corporate 10-K filings were associated with uncertainty in analyst earnings forecasts.[26] Alter and Oppenheimer found that stocks with easier-to-pronounce names performed better than stocks with less-fluent names, and that stocks with pronounceable three-letter symbols performed better than stocks with unpronounceable symbols.[27] Rennekamp found that more-readable investment disclosures increased the magnitude of small investors’ stock valuations. More-readable positive disclosures led to higher valuations than less-readable positive disclosures, and more- readable negative disclosures led to lower valuations than less-readable negative disclosures.[28]
Beyond the investment world, Shrank et al. summarized dozens of studies showing that content and format improvements in prescription drug labels increased patient comprehension. The improvements included using larger fonts, lists, headers, white space, simple language, and logical organization.[29] In a study of voter behavior, Reilly and Richey found that increasing language complexity on ballots made voters more likely to skip ballot questions.[30] Rogers and Brown found that subjects who received “high-impact” instructions complied with those instructions at a significantly higher rate than the group that received instructions in the “low-impact” style.[31] Finally, McGlone and Tofighbakhsh found that readers presented with two phrases with identical meaning more readily accepted and believed the version of the phrase that rhymed. For example, readers accepted the phrase “woes unite enemies” less frequently than “woes unite foes.”[32] Thus, substantial cross-disciplinary evidence shows that readability can affect reader comprehension and decision making. The question, then, is how to measure readability?
B. Quantitative Measures of Readability
Readability refers to “the ease of understanding or comprehension due to the style of writing.”[33] The study of readability dates back to classical Greek rhetoric and ancient Hebrew scholars’ vocabulary analysis of the Bible.[34] Modern readability research arose from two distinct fields of study — vocabulary control and readability measurement.[35] Vocabulary control studied how to make textbooks more effective by examining features such as the difficulty of the vocabulary, the repeating of words, and the introduction of new words.[36] Readability measurement, in contrast, focused on devising measures to rank texts in order of difficulty.[37]
These related fields of study arose in the 1920s for several reasons. First, 1921 saw publication of the “first extensive frequency word count of the English language, Thorndyke’s Teacher’s Word Book, which provided an objective measure of word difficulty.”[38] Second, the middle and high school populations were changing in the 1920s, as more students advanced past elementary school than in prior years. As a result, middle and high school textbooks written for earlier generations with stronger academic backgrounds might have proved too challenging for the new cohort.[39] In addition, researchers likely placed more emphasis on primary school readability in the 1920s when the prevailing approach to reading instruction shifted from a phonic approach to a sight-word approach, which required easier vocabulary.[40]
Researchers have developed hundreds of different readability measures based on structural and content features of text.[41] Structural features include the average numbers of syllables per word, words per sentence, and sentences per paragraph.[42] Content features include the average number of prepositional phrases, “easy” or “hard” words (based on a predetermined list), and first-person, second-person, or third-person pronouns.[43] Readability measures use different formulas that combine structural features, content features, or both, to generate a readability score.[44]
To understand what constitutes more “readable” writing according to these formulas, we look to advice from longtime readability researcher Edward B. Fry.[45] Fry explained how to improve a readability score without merely “gaming the system” of readability formulas.[46] Fry’s advice will be familiar to teachers of writing in general and legal writing in particular:
-
prefer simpler vocabulary to more difficult vocabulary;
-
keep most sentences relatively short;
-
keep most paragraphs relatively short;
-
use an organizational structure that is logical and obvious to the reader;
-
write cohesively by making explicit connections between sentences, between paragraphs, and between different parts of the passage;
-
prefer personal pronouns (him, her) to impersonal pronouns (it);
-
use imagery to help the reader visualize the writing; and
-
avoid misusing “referents,” i.e., pronouns or phrases that refer back to other portions of the writing.[47]
For many computer users, two common readability measures are easily accessible through Microsoft Word – the Flesch Reading Ease and Flesch-Kincaid Grade Level. Those measures, however, rely entirely on two structural features – syllables per word and words per sentence.[48] As we describe below, we have adopted a comprehensive approach to measuring readability by taking fifty different readability measures and then using factor analysis to create an index based on the most reliable set of measures.[49] The next section discusses the few prior studies of the relationship between readability and case outcome.
C. Prior Research on Correlation Between Readability and Case Outcome
So far, only three published studies have analyzed the association between brief readability and case outcome,[50] and no studies have analyzed that association in the trial courts, where most lawyers practice.[51] Long and Christensen sampled 882 appellate briefs from the Supreme Court, federal appellate courts, and state supreme courts.[52] Their dependent variable was the outcome of the appeal (affirmed or reversed), while their independent variable was readability measured by the Flesch Reading Ease score as calculated by Microsoft Word.[53] For federal appellate and state supreme court briefs, the researchers coded control variables for federal or state court, standard of review, presence of a dissenting opinion, and readability of the opinion deciding the appeal.[54] For United States Supreme Court briefs, the researchers coded control variables for constitutional issue, criminal or civil case, presence of a dissenting opinion, and opinion readability.[55] They found no statistically significant correlation between readability and outcome in the briefs in their study.[56]
Campbell published the early results of a similar study of petitioners’ and appellants’ briefs in the Supreme Court, Ninth Circuit, and California Supreme Court.[57] He used the StyleWriter writing and editing software package to capture eight different readability measures and coded one dependent variable (the appellant’s outcome).[58] When considering all appellate briefs, none of the eight readability measures showed a statistically significant correlation to appellant’s outcome. When he considered only Ninth Circuit briefs, however, two of the eight readability measures showed a statistically significant correlation to appellant’s outcome.[59]
Finally, Feldman studied the association between brief readability and case outcome in Supreme Court briefs.[60] He used two types of content analysis software that measured readability based on both dictionaries and word counts.[61] He coded two dependent variables. The first was case outcome and the second was the percentage of the brief’s language adopted in the Supreme Court’s opinion. Feldman found that readability was positively associated with both the likelihood of success and the percentage of language adopted, and that both associations were highly significant.[62]
Although no other study has analyzed readability’s relationship to case outcome, several have analyzed its relationship to the percentage of the brief’s language adopted in the court’s opinion. These studies use plagiarism detection software to identify the amount of overlap between the brief’s language and the opinion. For example, Feldman analyzed the quality of Supreme Court merits briefs using a composite of features such as passivity, wordiness, sentence length, and tone.[63] He found that brief readability was positively associated with the percentage of brief language adopted in the opinion and that the association was highly significant.[64] Similarly, Collins et al. analyzed the “cognitive clarity” and plain language of Supreme Court amicus briefs.[65] They measured cognitive clarity using the dictionary-based Linguistic Inquiry and Word Count program (LIWC), which relied on an index of categories that relate to cognitive clarity such as “causation, insight, discrepancy, inhibition, tentativeness, certainty, exclusiveness, inclusiveness, negations, and the percentage of words containing six or more letters.”[66] They also used LIWC to measure plain language by calculating the inverse of the average words per sentence.[67] Both were positively associated with the percentage of brief language adopted in the Court’s opinion and the associations were highly significant.[68] Our study builds on this multi-factor approach to measuring readability.
III. Methods
This section first describes our research design, including our reasons for studying summary judgment briefs, our protocol for selecting briefs to include in our sample, and our definition and coding of variables. This section then compares the summary judgment success rates in our sample with the success rates in the few prior studies of summary judgment success. Because the published summary judgment success rates are similar to those in our sample, we are comfortable relying on our findings to draw inferences about summary judgment brief success.
A. Research Design
This study uses a quantitative design to draw a sample of summary judgment briefs and study the correlation between readability and the outcome of the summary judgment motion. We selected summary judgment briefs for three reasons. First, summary judgment motions generate a measurable outcome: granted or denied. Second, summary judgment motions often turn on detailed questions of fact, and clear writing may help the court understand the author’s version of the factual record. Finally, because many more lawyers file trial-level briefs than appellate briefs,[69] the results of a trial-level study will be relevant to a larger audience.
Our study’s observational design drew on Westlaw’s database of state and federal trial court filings.[70] Our cross-sectional sampling design reviewed all summary judgment filings in Westlaw’s database from 2009 through 2012, and then applied a protocol to decide which observations to include. Specifically, we ran a search in Westlaw’s “Trial Court Documents” database[71] with the search filter set to include all state and federal cases. We sorted the results by date, with the most recent results first. The Westlaw search results intermingled state and federal cases based on the date of the briefs in question. The cases selected for analysis[72] did not contain partial summary judgments or cases with cross-motions for summary judgment because determining who “won” would be unduly subjective. We downloaded each brief from Westlaw as an .rtf file.
We reviewed the caption and procedural context of each brief to exclude cases containing cross-motions, counterclaims, and motions for partial summary judgment. Cases were included in the sample if they contained one brief in support of a motion for summary judgment, one in opposition, and an order granting or denying the motion. Reply briefs were excluded.[73]
We also gathered data about the author of each brief. We first used Westlaw’s Attorney Profile feature to learn more about each brief’s author.[74] The items of interest from these profiles include when the attorney was admitted to the bar and the size of the attorney’s office and firm. We then used the Litigation History tool to ascertain the number of cases in which the attorney had appeared as well as the number of appearances before the specific judge who decided the motion.
We preprocessed the briefs to develop a composite measure for brief readability. To focus on the readability of the attorney’s writing, we removed all text between two sets of quotation marks. We also removed citations, which would otherwise affect readability measures with their punctuation. To do this, we removed any text that contained a hyperlink or that was italicized in the original Westlaw document.[75]
With the preprocessing complete, we were able to calculate readability. We did this by loading text files of each brief in our sample into R-Studio, which is a framework that supports various data science plugins. We used a plugin called the Quanteda package, which is designed for quantitatively assessing textual data, such as the language used in court briefs. Quanteda has 50 different measures of readability, ranging from relatively common metrics such as SMOG and Flesch-Kincaid to more obscure metrics such as Strain.[76] The 50 measures use different algorithms based on word, syllable, letter, and sentence counts, as well as word difficulty, to determine a numeric score for readability.[77]
We then used Stata software, a statistical analysis tool, to analyze the 50 readability measures per brief and to generate a composite readability score for each brief. To do this, we applied factor analysis with principal-component factoring to find the readability factor that accounted for the most variance of the full set of readability measures.[78] Our readability factor statistically accounts for a large amount of the variance of the full set of the composited readability measures.[79]
Quanteda also contains measures for lexical diversity, which rate the diversity of language used in a text.[80] To create lexical diversity scores from the seven lexical diversity measures provided in the program, we followed a similar process to the one we used to create readability scores. Lexical diversity helps to control for the possibility that, as with difficult readability scores, briefs with more diverse language will be less likely to prevail.
Along with these two variables that capture qualities internal to the briefs themselves, we included several control variables for factors external to the briefs. The first looks at whether a given case is the first in which an attorney has appeared before the motion judge. We included this variable based on the theory that repeat players before a particular judge may develop a reputation with the judge or may have a better grasp on a judge’s protocol peccadillos.
Next, we included a variable for the number of cases in which a given attorney has appeared, according to Westlaw’s directory. The directory goes back to 1990, so this variable looks at the number of cases in which an attorney appeared from 1990 to the year the brief was filed. Due to the large variation in this count variable across attorneys, we used the natural log of this variable in our multivariate analyses.
Lastly, based on Westlaw’s categorization for firm and office sizes, we created an ordered variable for each based on the possibility that an attorney with greater firm or office resources at his or her disposal may have an inherent advantage over attorneys with relatively less resources. Because Westlaw uses eight divisions for firms and offices, these ordered variables move from 1 to 8 with numbers that increase according to office and firm size.[81]
B. Descriptive Statistics and Data
The relevant population for our data consists of all summary judgment briefs filed in federal and state trial courts. We chose this population in part because summary judgment motions are frequently used litigation tools. Although courts do not publish the number of summary judgment motions filed each year, we can estimate how frequently lawyers file summary judgment motions based on published studies.
In the most comprehensive study to date, Cecil and Cort analyzed summary judgment activity across all federal district courts in fiscal year 2006.[82] They initially identified 62,938 summary judgment motions filed in the 276,120 civil cases terminated in 2006.[83] Thus, they found summary judgment motions filed in 22.8% of the cases in their sample.[84] In another study, Cecil et al. analyzed summary judgment practices in six federal district courts in six distinct time periods from 1975 to 2000.[85] The six federal district courts had high volumes and represented 20% of all civil cases in federal district courts in 2000.[86] They found that the frequency of summary judgment motions had increased from 12% of civil cases in 1975 to 19% of civil cases in 2000.[87] Based on these studies, lawyers can expect to seek or oppose summary judgment in roughly one out of five civil cases, which makes summary judgment an important area of study.
Our sample contains 654 total briefs and 327 case-level observations.[88] Because we have data for both federal and state courts, our first interest was in whether success rates differed in these two forum types for moving and nonmoving parties. As Table 1 shows, these rates varied considerably. The higher success rate in federal court versus state court in our sample is consistent with the limited data available comparing federal and state court summary judgment rates, which also how a higher likelihood of success in federal court.[89]
In addition, the disparity in success rates in our federal court sample for moving versus non-moving parties and defendants versus plaintiffs is comparable to the disparity in prior federal court summary judgment studies. In our federal court sample, defendants moving for summary judgment succeeded more often (77%) than plaintiffs moving for summary judgment (61%). Similarly, Cecil et al. found that defendants moving for summary judgment were awarded summary judgment in full 64% of the time, whereas plaintiffs moving for summary judgment were awarded summary judgment in full only 39% of the time.[90] In a subsequent study of all federal district court summary judgment activity in 2006, Cecil and Cort found that moving parties succeeded more often (57%) than non-moving parties (43%), as was the case for moving parties in federal court in our sample (73% to 27%).[91] Although success rates in our sample were higher than success rates in the Cecil study and the Cecil and Cort study, a higher success rate is expected given that we excluded motions seeking partial summary judgment from our sample. In the Cecil and Cort studies, unsuccessful motions for partial summary judgment appear in the “deny” outcome, thus depressing success rates in comparison to our sample.
We propose at least three possible reasons why federal courts grant summary judgment more frequently than state courts. First, some states use a summary judgment standard that is less favorable to the moving party than that in federal court.[92] Second, federal court judges handle cases from start to finish, whereas many state court cases are not assigned to individual judges until trial. As a result, federal court judges have a stronger personal incentive to grant summary judgment than some of their state court counterparts.[93] Finally, federal courts have more resources at their disposal than state courts and are therefore in a better position to invest the significant judicial resources often required to decide a motion for summary judgment.[94]
This section has described our raw data and our measures of interest in preparation for our analysis. Because the summary judgment success rates in our sample are comparable to published success rates, our findings are sufficiently generalizable to the larger population of state and federal court summary judgment motions. The following section describes the results of our analysis using the data and measures described above.
IV. Results
The data described above allowed us to test our hypotheses regarding brief readability and summary judgment success. This section details our analyses and findings. Our variable of interest is whether the moving party was successful at the summary judgment stage. We describe the variables we use in greater detail and provide descriptive statistics for the variables concerning brief readability, lexical diversity, attorney repeat-player status, total attorney experience, and attorney law firm size. We next describe the results of our logit models, which considered not only each brief’s readability, but also how readable it was compared to the opposing brief. Finally, we describe the results of our multilevel probit models, which considered each brief’s raw readability score without regard to the opposing brief’s readability.
Table 2 provides the descriptive statistics for our six variables of interest.
We did not create bounds for the readability or lexical diversity variables, so they both settled with a mean of 0 and a standard deviation of 1.[95] Readability scores in our data run from -4.5 to 3.2, where higher scores indicate more readable briefs. Lexical diversity moves from -3.5 to 2.8, with higher numbers indicating greater language complexity.
Although we coded a dichotomous variable for whether an attorney practiced previously before a particular judge, we provide the continuous statistics in Table 2. These show that there is a very wide range of attorneys’ practice experience before individual judges. Because there are likely diminishing returns for increased practice opportunities before a particular judge over time, and the effect of this relationship may vary between judge/attorney pairs, we chose not to base the variable on the continuous counts of cases. Lastly, we provide the statistics for our variables based on the log of an attorney’s case practice experience, and for the ordered variables of firm and office resources.
We began our multivariate analysis looking at the models with observations based on both briefs within each case. They can be found in Table 3 below in the columns labeled 1-3. In each model, we started with an assumption that a moving party has an advantage over the non-moving party. This assumption reflects the fact that the moving party controls whether to file a motion in the first place, and is consistent with the data suggesting that moving parties have a greater than 50% success rate in federal court.[96] To test this assumption, we coded a dichotomous dependent variable as 1 if the moving party prevailed on the motion and 0 otherwise. We then used logit models with robust standard errors for our tests.[97]
We also created variables based on the difference between the moving and non-moving party’s readability scores in each case.[98] The Difference in Readability Score variable looks at the difference between each moving and non-moving party’s readability scores.[99] We then coded each attorney’s number of appearances before the motion judge. Using those counts, we created a dichotomous variable based on whether the moving party had more experience, and we used that dichotomous variable in our analysis. We ran models that focused only on whether the moving attorney had repeat experience before a judge as well as a model that also accounted for whether the attorney for the non-moving party had similar repeat experience. Lastly, we have three dichotomously coded variables for whether the attorney for the moving party had appeared in a greater number of cases, whether the moving attorney had greater firm resources, and whether the moving attorney had greater office resources. The logit estimates are below.
Positive values in these models indicate an increased likelihood that the moving party will prevail on summary judgment. When the moving party’s brief was more readable, the moving party was typically more likely to prevail, as we found the readability score variable significant at the .05 p-level in three of four models.[100] The only model where this score was not significant at a tested p-level was based on the isolated sample of state court cases.[101]
The other variable of significance in two of our models is whether an attorney has prior experience before the motion judge. This variable moves in the expected positive direction in all models except for the state court model, and is significant when we do not include the same variable for the non-moving party. The difference in significance in the models containing the non-moving party variable may highlight a leveling effect where a repeat non-moving attorney counterbalances some of the advantage a moving attorney has from repeat exposure to a particular judge.
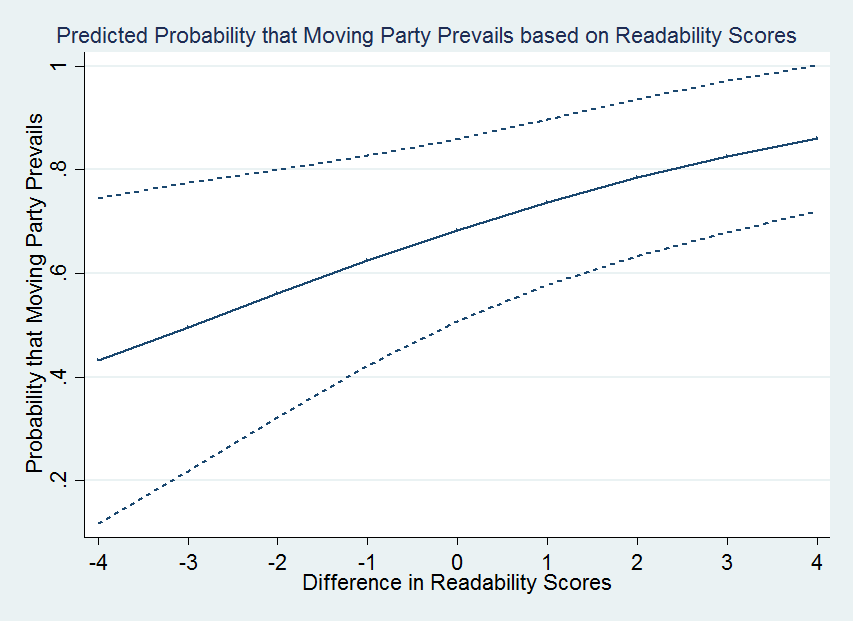
Although logit results provide evidence of a variable’s significance, the magnitude of the relationship cannot be directly analyzed from these model results. The numbers resulting from a logit analysis are only useful when comparing two variables from the model. In our model, we compare the predicted probabilities of a moving party’s success based on the magnitude of difference between the moving and non- moving party’s readability scores. To generate predicted probabilities, we held all variables at their means (or modal values if dichotomous) aside from the difference in readability score variable, which we varied from -4 to 4 based on the spectrum of our data.[102] The results for the predicted probability that a moving party prevails on a motion for summary judgment based on a given readability score are presented in Figure 1 below.[103]
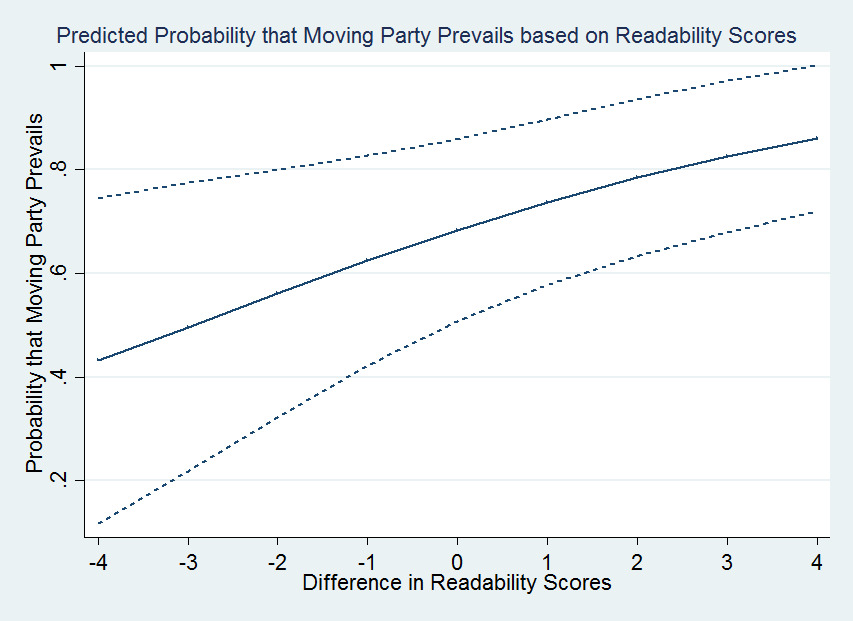
Moving from cases where the moving party’s brief is significantly less readable than the non-moving party’s brief to the opposite situations, the likelihood that the moving party prevails on the motion for summary judgment more than doubles from 42% to 85%. The confidence interval also perceptibly narrows towards the higher end of difference values where the moving party’s brief is more readable.
These results, however, tell only part of the story. The models above look at the moving party’s advantage when having the more readable brief in a given case. Another way to inspect this puzzle is by looking at each brief independently. Looking at each brief individually, however, poses a risk. Because both briefs in the same case deal with similar subject matter, there will be some degree of similarity between two briefs in the same case. This similarity is due to both parties discussing the same underlying facts and issues, which can also lead to convergence in language.
To minimize this risk when modeling briefs as independent observations, we used multilevel probit models with robust standard errors.[104] Multilevel models are designed to account for correlation in dyadic pairs of observations by nesting each pair within the same group.[105]
The variables in these models are similar but not identical to the variables in the first set of models. Because here we did not code based on the comparison of briefs within the same case, the dependent variable in these models is whether a brief was the prevailing brief on the motion. We used multilevel probit models based on this dichotomous variable. The control variables are not comparative in these models, either, so we used the raw readability scores, lexical diversity scores, and log of the number of total case appearances by the lead attorney on the brief. We also used similarly derived variables as in the first set of models for whether the attorney had repeat opportunities before the motion judge as well as the ordered variables for firm and office resources. In addition, because these models do not naturally control for the moving party, we included a dummy variable to control for the moving party’s advantage. The results of the model based on all observations, as well as those with only federal and only state observations, appear in Table 4 below.
Similar to the first set of models, the readability score variable is positive and significant in the all case and federal case models in Table 4. We found the same lack of significance for the readability score variable in the state case model here as well.[106] The all case and federal case models paralleled each other well. This has to do largely with the greater number of federal case than state case observations that compose the all case model. Along with the readability scores, the moving party variable is highly significant in the all case and federal case models. This accords with our descriptive statistics and the assumptions about moving party success that motivated Table 3.
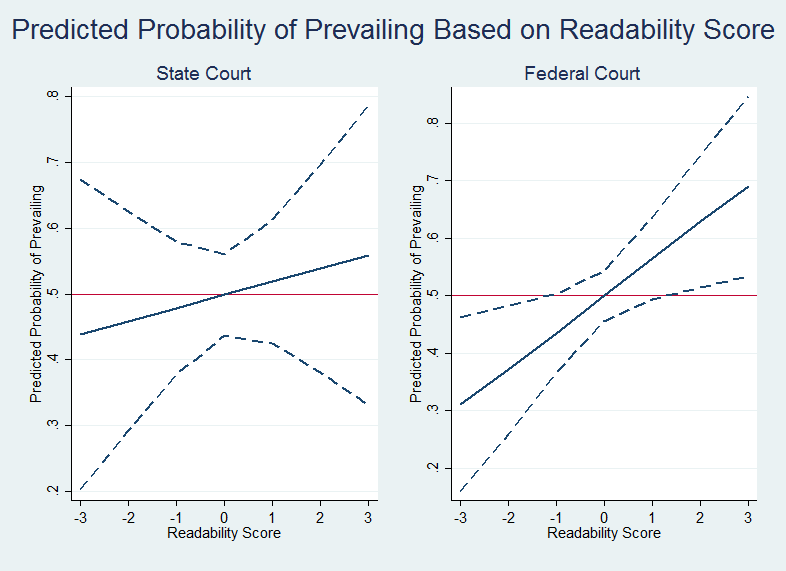
As with the first set of models, we ran predicted probabilities on the readability scores in these models. The results appear in Figure 2 below.[107]
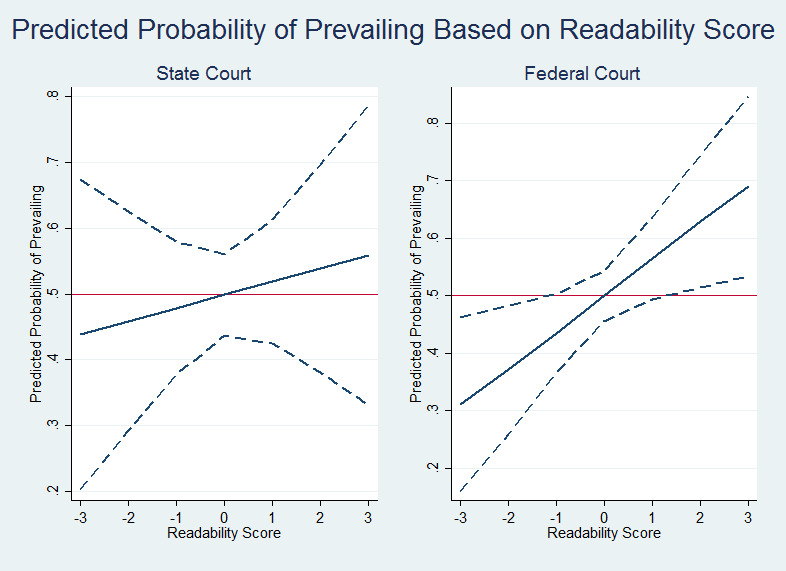
The difference in the predicted probability of success on a motion for summary judgment based on a brief’s readability score is much less stark in our state court sample than in our federal court sample. From least readable to most readable brief in state court, the likelihood of prevailing increases from 44% to 56%. By contrast, the likelihood of prevailing increases from 31% to 69% in federal court, according to the same variation in readability scores.
The second set of models provides additional robustness for our results in Table 3 as well. Taken together, the results highlight the importance of brief readability, especially in federal court summary judgment briefs. These data contrastingly suggest a cautionary tale about the negative outcomes that can arise from less-readable legal writing.
In this section, we presented multivariate analyses that demonstrated the importance of brief readability to summary judgment success. We also presented predicted probabilities which showed the extent to which brief readability affected summary judgment success in our sample. The next section considers the potential reasons for and implications of our findings.
V. Discussion
This section first considers why our findings are consistent with our hypothesis and the theory that greater readability is correlated with greater likelihood of success because readability promotes comprehension. This section next considers alternative theories that could explain our findings and why those alternative theories are largely inconsistent with our data. Finally, this section considers the implications of our findings for the legal profession.
A. Potential Explanations for Our Findings
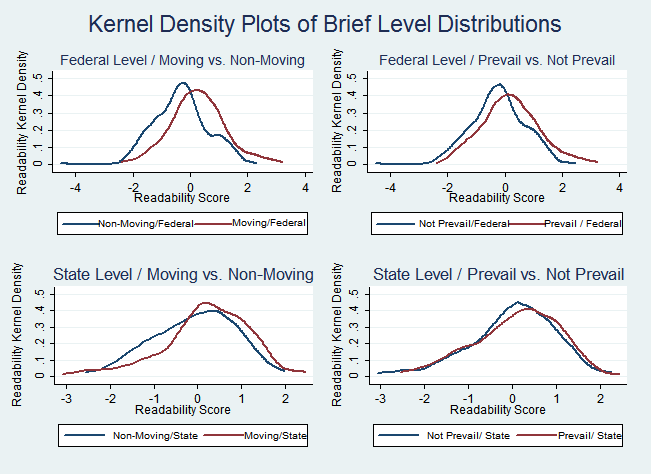
The results of our federal court sample are consistent with our two hypotheses. First, we saw a statistically significant correlation between brief readability and the likelihood of success on a summary judgment motion. Second, when the moving party’s brief was more readable than the non-moving party’s brief, we saw a statistically significant correlation with the moving party’s likelihood of success. Figure 3 shows the different readability levels in our federal and state court samples both by moving and non-moving parties and by prevailing and non-prevailing parties.
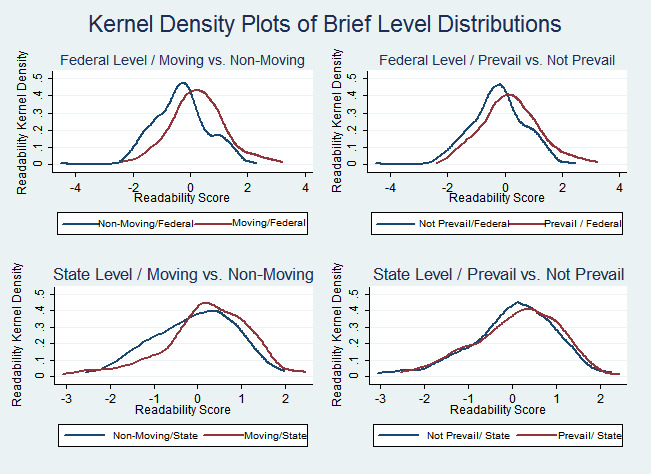
Starting at the top left in Figure 3, we see that at the federal level the moving parties’ briefs are noticeably more readable than non-moving parties’ briefs. At the state level, moving parties’ briefs also tend to be more readable, although the difference in the distributions is not as pronounced as it is at the federal level.[108]
Looking at the prevailing parties’ briefs, we first see that there is a clear difference in the federal court sample between the readability of prevailing and non-prevailing parties’ briefs. This distinction is not perceptible in the state court sample because the readability levels of both groups practically overlap.
The advantage for more-readable moving-party briefs is consistent with our theory about the relationship between readability and comprehension. Based on the research described above in Part 2,[109] our theory is that more-readable briefing increases the likelihood that the judge will understand the advocate’s view of the undisputed facts and their legal significance.
A related theory is that poor writing reflects poor thinking.[110] Under this theory, a lower readability score is a symptom of arguments that are inadequately developed or logically flawed. The quality of advocacy would still affect likelihood of success, but the readability score would serve as a proxy for the quality of the arguments themselves. This theory, however, rests on conventional wisdom rather than empirical research, so we place greater reliance on our primary theory that readability promotes comprehension.
We considered the potential implications of the different federal court and state court results. Although our state court sample size (n=124 brief pairs) is smaller than our federal court sample (n=203 brief pairs), this difference probably does not explain the discrepancy between our results for federal and state court motions. Nor does it explain why prevailing parties’ briefs are so much more readable in federal court than in state court. If sample size is not masking a significant correlation, the greater readability advantage in federal courts may be explained by the factors that depress the summary judgment success rate in state courts: more restrictive state summary judgment standards, the lack of state court resources compared with those in federal court, and state court judges’ relative reluctance to grant summary judgment.[111] Although greater readability could still influence the outcomes in some state cases, which would be consistent with the slight readability advantage in our sample, on the whole the anti-summary-judgment factors would reduce the potential readability effect on summary judgment outcome. In this regard, our results suggest that providing state courts with greater resources could yield outcomes more comparable to those in federal courts.
To further explore the reason for the greater readability advantage in federal courts compared to state courts, we investigated the average time from motion to decision. The average time from motion to decision in state court (88 days) was far shorter than in federal court (143 days). Figure 4 below shows additional differences between the time it took judges to reach decisions in our federal and state court samples.
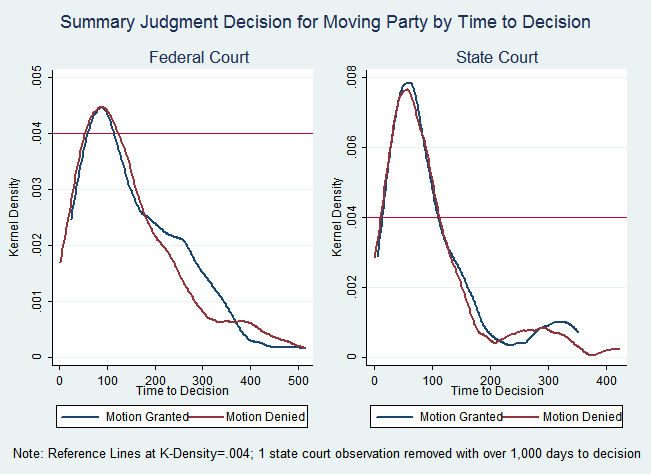
The distributions in Figure 4 show that state judges decided a greater proportion of their motions in the first hundred days than federal judges. Past this initial hump, the distributions also show that federal judges decided a larger proportion of their motions after 200 days than state judges.
Although the additional time that the federal judges took to make decisions is not dispositive of the result, it adds to the possibility that state judges viewing the heavy burden on summary judgment were and are less willing to grant these motions as a threshold matter and instead prefer to let cases proceed to trial or settlement.[112] By contrast, the federal judges who take more time in coming to decisions may put more weight on the summary judgment motions if they are, on the balance, more willing to grant them.
We investigated three alternative theories that might explain why more readable briefs were more likely to succeed. One theory is that greater readability merely serves as a proxy for “better” arguments—that is, arguments that rest on stronger factual and legal grounds.[113] Under this theory, one party’s brief is more readable than the opposing party’s brief because the first party has the stronger argument at the outset. Readability, therefore, would reflect one side’s greater chance of success rather than causing it. Our results neither confirm nor refute this theory.
A second alternative theory is that more-skilled advocates also write better, so what really influences the outcome is the lawyer’s skill in developing legal theories, conducting discovery, and marshaling facts, rather than the readability of the lawyer’s writing. However, neither of our multivariate analyses showed a statistically significant correlation between likelihood of success and the moving party’s total number of case appearances, size of law firm, or size of law office.[114] Thus, to the extent that these measures of experience or firm size are proxies for lawyer skill, our multivariate analyses cast doubt on the theory that readability is merely a proxy for lawyer skill.[115]
A final alternative theory is that readability serves as a proxy for lawyer experience and that more experienced lawyers select stronger cases. Under that theory, what really influences the outcome is the strength of the underlying case itself. Again, however, neither of our multivariate analyses showed a statistically significant correlation between likelihood of success and the moving party’s total number of case appearances. So to the extent that the number of case appearances serves as a meaningful proxy for experience, our results do not support the theory that more experienced lawyers both write better and select stronger cases. In addition, this theory rests on the questionable assumption that more experienced lawyers write more readably. In our sample, however, the correlation between readability and the number of cases in which an attorney had appeared was essentially nonexistent (.04).[116]
Our study revealed an interesting finding about the “repeat player” advantage. Our logit model showed that a moving party counsel’s status as a repeat player before the motion judge correlated significantly with success on the summary judgment motion.[117] However, when we also controlled for whether the non-moving party was a repeat player before the motion judge, the moving party correlation and the non-moving party correlation were no longer significant. This suggests that the moving party’s repeat player advantage is muted when the non-moving party is also a repeat player.
B. Implications for the Legal Profession
Our results offer a concrete incentive for lawyers to invest the time necessary to write as readably as possible. Lawyers and their clients have decried poor legal writing for centuries.[118] Yet lawyers may find it difficult to justify expending significant time editing their writing. Clients may push back on time charges for “editing.” And even lawyers who do not bill on an hourly basis (or do not bill at all) face pressure to be as efficient as possible. The possibility that clear writing may improve case outcomes should help lawyers justify additional editing time to themselves, colleagues, and clients.
Assuming that lawyers can find enough time for editing, how can they improve the quality of their writing? There are scores of legal writing textbooks and continuing education programs available. A classic primer that may be familiar to many lawyers is Richard Wydick’s Plain English for Lawyers.[119] His guidelines on effective writing are consistent with best practices advocated by the legal writing academy today, and they dovetail with the two types of readability measures we described above: word-count measures and dictionary-based measures. Three of his guidelines improve word count readability scores: omit surplus words; use short sentences; and use the active voice and “base verbs.”[120] A fourth guideline improves dictionary-based readability scores: use familiar, concrete words.[121] In addition to developing their own editing skills, lawyers can follow these guidelines by relying on proofreading software tools that identify surplus words and grammar mistakes.[122]
Our results also have implications for the inequitable allocation of legal services based on wealth. If more readable writing improves case outcomes, then wealthy clients can gain an advantage by hiring more effective writers or more lawyers to spend time editing. Conversely, poorer clients suffer a disadvantage when they depend on overburdened and underfunded counsel with insufficient time to spend editing. This disparity reinforces the familiar chasm between “haves” and “have nots” in our legal system.[123] Although many have written about the chasm in the criminal context,[124] it exists in civil litigation as well.[125] The disparity in writing offers yet another reason why the profession should strive to provide more legal resources to clients who cannot afford counsel of their choosing.
VI. Conclusion
This study is the first to our knowledge that uses quantitative methods to study the relationship between brief readability and case outcome at the trial court level. Previous quantitative studies have been limited to appellate courts, where briefs are more easily accessible and significant work has already been conducted to code a host of control variables. We expect that this study and the future research that flows from it will provide valuable insight to practicing attorneys who do the vast majority of their work in the state and federal trial courts.
Our results show that more-readable summary judgment briefs were more likely to prevail, even after controlling for attorney experience, law firm resources, and repeat-player status before the motion judge. More-readable briefs enjoyed a highly significant advantage in federal courts, where courts have greater resources to devote to reviewing summary judgment motions. In more resource-strapped state courts, more-readable briefs were more likely to prevail, though the difference was not statistically significant.
Our results support the ever-increasing emphasis on legal writing instruction in law school curricula, the ABA standards on law school accreditation, and continuing legal education programs. In addition to the many other reasons to strive for effective legal writing, these results provide empirical, not just anecdotal, support for the theory that more readable writing can make a difference, although of course our study does not prove a causal relationship.
Our results also suggest valuable additional research questions. First, a larger observational study using a similar model may help further clarify whether readability plays a different role in federal and state courts. For example, judges and lawyers could decide a hypothetical case based on two sets of briefs shown to various subjects in varying combinations of high-readability and low-readability. Finally, our results set the stage for future qualitative studies exploring how readability differentials manifest themselves in opposing briefs, whether readers are conscious of readability differentials between opposing briefs, and how readability differentials factor into the decision-making process.
APPENDIX
(1) PROTOCOL FOR INCLUSION IN SAMPLE
-
Perform the following search in Westlaw’s Trial Court Documents – Motions database, all state and federal:
“advanced: DT((((MOTION MEMORAND! REQUEST RESPONSE OBJECTION APPLICATION BRIEF REPLY) +10 (SUMMARY +4 JUDGMENT))) % (REPLY or PARTIAL)) & DA(aft 01-01-2009 & bef 01-01-2013)”
-
Sort the results list by date
-
For each document in the list, starting with the most recent:
a. Does the brief involve a motion for summary judgment in full (rather than some form of partial summary judgment)?
i. If not, exclude this brief
ii. If so, continue
b. Is the brief the moving or non-moving party’s principal brief (rather than a reply brief or supplemental brief)?
i. If not, exclude this brief
ii. If so, continue
c. Is there an opinion or docket sheet that shows a motion granting SJ in full or denying SJ in full (rather than some form of partial SJ)?
i. If not, exclude this brief
ii. If so, continue
d. Is the other party’s principal brief also available?
i. If not, exclude this brief
ii. If so, continue
(2) ADDITIONAL DESCRIPTIVE STATISTICS
For attempts to measure the effect of advocacy quality through other means, see, e.g., Banks Miller et al., Leveling the Odds: The Effect of Quality Legal Representation in Cases of Asymmetrical Capability, 49 Law & Soc’y Rev. 209 (2015) (finding that high quality representation evened the odds for asylum applicants and that asylum seekers fared better when unrepresented than when represented by a poor lawyer); Mitchell J. Frank & Dr. Osvaldo F. Morera, Professionalism and Advocacy at Trial – Real Jurors Speak in Detail About the Performance of Their Advocates, 64 Baylor L. Rev. 1, 38 (2012) (finding statistically significant correlations in criminal cases between jurors’ perceptions of closing argument persuasiveness and jury verdict, and finding statistically significant correlations in civil cases between perceptions of defense counsel’s closing argument persuasiveness and defense verdict); James M. Anderson & Paul Heaton, How Much Difference Does the Lawyer Make? The Effect of Defense Counsel on Murder Case Outcomes, 122 Yale L.J. 154 (2012) (finding that public defenders enjoyed a statistically significant advantage in sentencing outcomes compared to court-appointed private counsel); Jennifer Bennett Shinall, Note, Slipping Away from Justice: The Effect of Attorney Skill on Trial Outcomes, 63 Vand. L. Rev. 267, 291 (2010) (finding that skill of defense attorney made no difference in the outcome of non-celebrity criminal jury trials, but that skill of prosecutor played a significant role in the outcome); see also Emily S. Taylor Poppe & Jeffrey J. Rachlinski, Do Lawyers Matter? The Effect of Legal Representation in Civil Disputes, 43 Pepp. L. Rev. 881 (2016) (citing dozens of studies across civil practice areas demonstrating that clients have better outcomes when represented than when pro se).
See infra Section IV.
For example, Wolters Kluwer lists 68 textbooks and study aids in its legal research and writing category, http://www.wklegaledu.com/web-catalog/law-school/legal-research-and-writing (last visited Sept. 30, 2017). Carolina Academic Press lists 83 titles in its legal writing category. http://www.cap-press.com/ms/41/Legal-Writing (last visited Sept. 30, 2017).
See, e.g., Linda L. Berger, Linda H. Edwards, & Terrill Pollman, The Past, Presence, and Future of Legal Writing Scholarship: Rhetoric, Voice, and Community, 16 Leg. Writing 537, 548 n.46-48 (2010) (citing Sourcebook on Legal Writing Programs 149-74 (Ralph L. Brill et al. eds., 1997)); Terence Collins & Darryl Hattenhauer, Law and Language: A Selected, Annotated Bibliography on Legal Writing, 33 J. Legal Educ. 141 (1983); George D. Gopen & Kary D. Smout, Legal Writing: A Bibliography, 1 Leg. Writing 93 (1991); James R. Elkins, The Things They Carry into Legal Writing (and Legal Education), 22 Legal Stud. Forum 749, 77888 (1998); Kathryn Stanchi, Persuasion: An Annotated Bibliography, 6 J. ALWD 75 (2009); Carrie W. Teitcher, Legal Writing Beyond Memos and Briefs: An Annotated Bibliography, 5 J. ALWD 133 (2008); Terrill Pollman & Linda H. Edwards, Scholarship by Legal Writing Professors: New Voices in the Legal Academy, 11 Leg. Writing: 3, 15 (2005); Michael R. Smith, The Next Frontier: Exploring the Substance of Legal Writing, 2 J. ALWD 1 (2004).
David S. Romantz, The Truth About Cats and Dogs: Legal Writing Courses and the Law School Curriculum, 52 U. Kan. L. Rev. 105, 127—28 (2003) (tracing the evolution of legal writing instruction in law schools back to moot court exercises during Langdell’s tenure at Harvard Law School).
2017-2018 ABA Standards and Rules of Procedure for Approval of Law Schools, Standard 303(a)(2) (requiring a school’s program of legal education to include “one writing experience in the first year and at least one additional writing experience after the first year”), https://www.americanbar.org/groups/legal_education/resources/standards.html (last visited Sept. 30, 2017).
Interviews with United States Supreme Court Justices, 13 Scribes J. Legal Writing 1-182 (2010). For example, Chief Justice John Roberts said that “[t]he oral argument is the tip of the iceberg – the most visible part of the process – but the briefs are more important.” Id. at 6. Justice Ruth Bader Ginsburg explained that the “brief is ever so much more important” than the oral argument. Id. at 136. Justice Samuel Alito noted that “[i]t’s extremely important [that lawyers write well]. . . . The first quality, of course, that’s necessary . . . is clarity . . . .” Id. at 170. And the late Justice Antonin Scalia advised attorneys to “[v]alue clarity above all other elements of style.” Antonin Scalia & Bryan A. Garner, Making Your Case: The Art of Persuading Judges 107 (2008).
Richard A. Posner & Albert H. Yoon, What Judges Think of the Quality of Legal Representation, 63 Stanford L. Rev. 317, 325 (2011). See also Mark R. Kravitz, Written and Oral Persuasion in the United States Courts: A District Judge’s Perspective on their History, Function, and Future, 10 J. App. Prac. & Process 247 (2009) (noting that the bulk of persuading judges is performed through the written brief).
For example, a search for “legal writing” on the Massachusetts Continuing Legal Education website revealed several legal writing resources published since 2012, including “Drafting Persuasive Memoranda in Criminal Cases,” “Legal Research and Writing for Paralegals,” “Legal Writing and Persuasion in the Smart Phone Age,” and “Writing to Win with Judge Gertner.” http://mcle.org/product/search (last visited Sept. 30, 2017). Accord New York State Bar Association’s Continuing Legal Education Programs, http://www.nysba.org/cle (“Superior Legal Writing Workshop: Litigators,” “Superior Legal Writing Bootcamp/Transactional Attorneys,” and “Persuasive Legal Writing for Lawyers”) (last visited Sept. 30, 2017). Legal writing guru Bryan Garner lists thirteen live and online seminars on legal writing offered during November and December 2017, http://lawprose.org/cle_seminars/schedule.php (last visited Sept. 30, 2017).
Unfortunately, in a comprehensive study of lawyers, judges, and legal writing professors, 94% agreed that there are problems with the quality of legal writing today, and 57.3% said that they did not think new lawyers write well. Susan Hanley Kosse & David T. ButleRitchie, How Judges, Practitioners, and Legal Writing Teachers Assess the Writing Skills of New Law Graduates: A Comparative Study, 53 J. Legal Educ. 80, 85-86 (2003).
Of course, even without evidence that good writing is positively associated with favorable outcomes, lawyers have other important reasons to write well, such as preserving one’s professional reputation, conserving judicial resources, and promoting the image of the profession. See, e.g., Amy Vorenberg & Margaret Sova McCabe, Practice Writing: Responding to the Needs of the Bench and Bar in First-Year Writing Programs, 2 Phoenix L. Rev. 1, 10 (2009) (reporting that judges and practitioners surveyed “raised the concern that poor writing reflects negatively on the profession”); id. at 20-21 (judges reported on how legal writers can be helpful, and unhelpful, to the court); id. at 21 (“Several judges noted that both excellent and sloppy work stand out, resulting in appropriate professional reputations for the authors.”); K.K. DuVivier, Reputation, Colo. Law., May 2004, at 53 (“Whenever you send out a piece of paper or, nowadays, an e-mail, your reputation flutters or flickers on the words you write.”); Martin Cutts, Oxford Guide to Plain English 223 (4th ed. 2013) (“The way many lawyers write is disappointing to their friends and obnoxious to their clients.”).
For the proposition that justice requires that judges treat like cases alike, see, e.g., H.L.A. Hart, The Concept of Law 159 (2d ed. 1994) (“[J]ustice is traditionally thought of as maintaining or restoring a balance or proportion, and its leading precept is often formulated as ‘Treat like cases alike,’; though we need to add to the latter 'and treat different cases differently.”') (emphasis in original); Ronald Dworkin, Hard Cases, 88 Harv. L. Rev. 1057, 1090 (1975) (“The gravitational force of a precedent may be explained by appeal, not to the wisdom of enforcing enactments, but to the fairness of treating like cases alike. A precedent is the report of an earlier political decision; the very fact of that decision, as a piece of political history, provides some reason for deciding other cases in a similar way in the future.”). One judge has acknowledged that, despite the urge to decide cases on the merits rather than based on the advocate’s performance, “[w]hen there is a close case–and judges decide many close cases–a voice in the judge’s head will be quietly rooting against the bully and for the reasonable lawyer. Only a fool would think that the voice rooting for the reasonable lawyer and against the bully has no influence in deciding those close cases.” Judge Jay Quam, Adversarial Advocacy: Too Much Adversity Can Hurt You, Bench & B. Minn., Apr. 2011, at 22, 23.
Kenneth D. Chestek, Judging by the Numbers: An Empirical Study of the Power of Story, 7 J. ALWD 1 (2010).
Sean Flammer, Persuading Judges: An Empirical Analysis of Writing Style, Persuasion, and the Use of Plain English, 16 Leg. Writing 183 (2010). We tested the validity of our readability measures, described in more detail below in Section III(A), against samples from the Flammer article. Our readability measures accorded with Flammer’s hypothesis that his “Plain English” sample was most readable, followed closely by the “informal” sample. His study’s “legalese” sample was much less readable than the other two.
Robert W. Benson & Joan B. Kessler, An Empirical Study of Persuasion and Credibility in Appellate Brief Writing, 20 Loy. L.A. L. Rev. 301 (1987).
Steve Harrington & Joseph Kimble, Survey: Plain English Wins Every Which Way, Mich. B.J. Oct. 1987, at 1024.
Adam Feldman, Counting on Quality: The Effect of Merits Brief Quality on Supreme Court Opinion Content, 94 Denv. L. Rev. 43, 45 (2016) [hereinafter Feldman, Counting on Quality] (finding statistically significant relationship between Supreme Court brief readability and both case outcome and percentage of language that the Court incorporated into its opinion); Lance Long & William F. Christensen, Does the Readability of Your Brief Affect Your Chance of Winning an Appeal?, 12 J. App. Prac. & Process 145, 145-47 (2011) [hereinafter Long & Christensen, Winning an Appeal] (finding no statistically significant relationship between appellate brief readability and success on appeal); Lance N. Long & William F. Christensen, Clearly, Using Intensifiers Is Very Bad—Or Is It?, 45 Id. L. Rev. 171, 171-73 (2008) [hereinafter Long & Christensen, Using Intensifiers] (finding a statistically significant relationship between the use of intensifiers in appellants’ briefs and success on appeal). Of course, analyzing writing clarity is not the only way to measure the quality of a brief. For a qualitative study measuring quality of plaintiffs’ briefs in 102 employment law summary judgment cases using measures such as poor tactical decisions and failure to cite favorable law, see Scott A. Moss, Bad Briefs, Bad Law, Bad Markets: Documenting the Poor Quality of Plaintiffs’ Briefs, Its Impact on the Law, and the Market Failure It Reflects, 63 Emory L.J. 59, 80-82 (2013) (finding that 72% of plaintiff’s briefs omitted key arguments and case law, and that low-quality briefs lost at summary judgment far more frequently (88%) than high-quality briefs (44%)).
For a thorough history of the evolution of legal writing instruction in law schools, see Romantz, supra note 5, at 127—36 (tracing the evolution of legal writing instruction in law schools from the early days of moot court exercises under Dean Langdell at Harvard Law School, through the ABA’s formal recognition of legal writing as a law school subject in 1947, and through the widespread adoption of legal writing programs in American law schools); Jeffrey D. Jackson & David R. Cleveland, Legal Writing: A History from the Colonial Era to the End of the Civil War, 19 Leg. Writing 191 (2014) (describing legal writing instruction from the colonial apprentice system through the evolution of legal education into the modern university system); see also Terrill Pollman, Building A Tower of Babel or Building A Discipline? Talking About Legal Writing, 85 Marq. L. Rev. 887, 894-95 (2002) (noting that relatively few law schools offered significant formal instruction in legal writing until the 1980s); Smith, supra note 4, at 22 (2004) (noting that many law schools did not start hiring full-time, long-term professionals to teach legal writing until around 2000); Jo Anne Durako, A Snapshot of Legal Writing Programs at the Millennium, 6 Leg. Writing 95, 112 (2000) (noting the dramatic shift toward full-time legal writing instruction in law schools around the turn of the millennium).
Julie A. Baker, And the Winner Is: How Principles of Cognitive Sciences Resolve the Plain Language Debate, 80 UMKC L. Rev. 287, 295—96 (2011).
Id. at 296.
Id. at 296-97.
Id.
Id. at 297 (citing Daniel M. Oppenheimer, The Secret Life of Fluency, 12 Trends Cognitive Sci. 237, 239 (2008)).
Id.
For a discussion of studies showing fluency’s effect on comprehension and decision making, see generally Daniel Kahneman, Thinking, Fast and Slow 59—70 (2011). Kahneman refers to the concept of fluency as “cognitive ease.” Id. at 59.
Reuben Lehavy et al., The Effect of Annual Report Readability on Analyst Following and the Properties of Their Earnings Forecasts, 86(3) Acct. Rev. 1087 (May 2011). The study measured readability using the Gunning Fog Index, which generates a readability score based on the number of words per sentence and the frequency of complex words. Id. at 1088.
Adam L. Alter & Daniel M. Oppenheimer, Predicting Short-Term Stock Fluctuations by Using Processing Fluency, 103 Proc. Nat’l Acad. Sci. 9369, 9371 (2006) (cited in Baker, supra note 19, at 288).
Kristina Rennekamp, Processing Fluency and Investors’ Reactions to Disclosure Readability, 50 J. Acct. Res. 1319 (2012).
William Shrank et al., Effect of Content and Format of Prescription Drug Labels on Readability, Understanding, and Medication Use: A Systematic Review, 41(5) Annals of Pharmacotherapy 783 (April 2007).
Shauna Reilly & Sean Richey, Ballot Question Readability and Roll-Off: The Impact of Language Complexity, 64(1) Pol. Res. Q. 59 (March 2011).
H.G. Rogers & F.W. Brown, The impact of writing style on compliance with instructions, 23(1) J. Technical Writing & Comm. 53 (1993). Rogers and Brown’s “high-impact” instructions used simple sentences with subjects close to verbs, active verbs, concrete language, and first- and second-person pronouns. Id. at 54—55, 68—69. In contrast, their “low-impact” instructions used complex sentences, passive voice, many modifiers and qualifications, and abstract language. Id. at 56, 69.
Matthew S. McGlone & Jessica Tofighbakhsh, Birds of a Feather Flock Conjointly (?): Rhyme as Reason in Aphorisms, 11 Psychol. Sci. 426 (2000) (cited in Baker, supra note 19, at 299).
William H. DuBay, The Principles of Readability 3 (2004), http://www.impact-information.com/impactinfo/readability02.pdf (citing George Klare, The Measurement of Readability (1963)).
Jeanne S. Chall, The Beginning Years, in Readability: Its Past, Present and Future 2 (Beverley L. Zakaluk & S. Jay Samuels eds., 1988).
Id.
Id.
Id.
Id. at 3.
Id.
Id. at 4.
Louis J. Sirico, Jr., Readability Studies: How Technocentrism Can Compromise Research and Legal Determinations, 26 Quinnipiac L. Rev. 147, 162 n.87 (2007); Long & Christensen, Winning an Appeal, supra note 17, at 149 (2011); DuBay, supra note 33, at 2.
DuBay, supra note 33, at 18 (describing structural features identified by Gray and Leary); id. at 21 (describing the Flesch Reading Ease formula).
Id. at 18 (describing writing features used by Gray and Leary); id. at 23 (describing the original Dale-Chall formula).
Id. at 10—55 (describing dozens of different readability measures and their formulas). For a critique of readability formulas and metrics, see Walter Kintsch & Douglas Vipond, Reading Comprehension and Readability in Educational Practice and Psychological Theory, in Perspectives on Memory Research 329 (Lars-Göran Nilsson ed., 1979). One critique of readability formulas in general is that the predictors (such as word or sentence variables) merely correlate with what is “hard” about reading the passage; they do not cause it. For example, an explanation of complex ideas may contain many conjunctions. In that case, the conjunctions do not cause the difficulty; they are merely symptoms of it. Id. at 337 (urging “reading time, recall, and question answering” as more reliable measures of readability). For a critique of readability studies in the context of legal writing, see Sirico, supra note 41.
See DuBay, supra note 33, at 44—47 (discussing Edward Fry’s development of the Fry Readability Graph).
Edward B. Fry, Writability: The Principles of Writing for Increased Comprehension, in Readability, supra note 34, at 77.
Id. at 78—87. Accord Kosse & ButleRitchie, supra note 10, at 84—85 (reporting that lawyers, judges, and law professors most frequently listed concision, clarity, and organization as the most important qualities of good legal writing).
Sirico raises significant uncertainty about how Microsoft calculates the Flesch and Flesch-Kincaid formulas because Microsoft reports only characters per word rather than the syllables per word required in the Flesch and Flesch-Kincaid formulas. He speculates that Microsoft may use an algorithm to estimate syllables per word, but notes that manual calculation of the Flesch and Flesch-Kincaid formulas generates different scores than Microsoft’s calculation. Sirico, supra note 41, at 165—66.
See infra text accompanying note 78.
Feldman, Counting on Quality, supra note 17, at 62—64 (finding statistically significant relationship between Supreme Court brief readability and both case outcome and percentage of language that the Court incorporated into its opinion); Long & Christensen, Winning an Appeal, supra note 17, at 157 (finding no statistically significant relationship between appellate brief readability and success on appeal). Long and Christensen also studied the correlation between the use of “intensifiers” and appellate case outcome. Long & Christensen, Using Intensifiers, supra note 17, at 173—74. Intensifiers are words or phrases such as “clearly,” “obviously,” or “very.” Id. at 173. After calculating the average number of intensifiers per page (the “intensifier rate”), Long and Christensen found no statistically significant relationship between intensifier rate and case outcome in appellee’s briefs. Id. at 182. For appellant’s briefs, however, they found a significant though complicated relationship: “As the appellant’s [intensifier rate] increases, the odds of reversal generally decreases. However, this negative impact of appellant intensifier usage is mitigated (or even reversed) as the [intensifier rate] in the judge’s opinion increases.” Id. at 185.
Other researchers have conducted descriptive studies of brief or opinion readability without analyzing the association of readability and case outcome. See, e.g., Brady Coleman & Quy Phung, The Language of Supreme Court Briefs: A Large-Scale Quantitative Investigation, 11 J. App. Prac. & Process 75 (2010) (analyzing Supreme Court brief readability using Flesch Reading Ease, Gunning Fog, and Flesch-Kincaid tests, and reporting variation in readability for different types of litigant and across time periods); Ian Gallacher, “When Numbers Get Serious”: A Study of Plain English Usage in Briefs Filed Before the New York Court of Appeals, 46 Suffolk U. L. Rev. 451 (2013) (using Flesch Reading Ease and Flesch-Kincaid test to measure readability and finding gradual reduction in readability from 1969 through 2008); Keith Carlson, Michael A. Livermore, & Daniel Rockmore, A Quantitative Analysis of Writing Style on the U.S. Supreme Court, 93 Wash. U. L. Rev. 1461 (2016) (analyzing Supreme Court opinions for positive/negative sentiment, defensiveness, and Flesch-Kincaid Grade Level over time); Stephen M. Johnson, The Changing Discourse of the Supreme Court, 12 U.N.H. L. Rev. 29 (2014) (using Flesch-Kincaid test to describe brief readability during the Supreme Court’s 1931-33 and 2009-11 terms); Ryan J. Owens, Justin Wedeking, & Patrick C. Wohlfarth, How the Supreme Court Alters Opinion Language to Evade Congressional Review, 1 J. Law & Courts 35 (2013) (analyzing cognitive clarity of Supreme Court opinions, and hypothesizing that the Supreme Court crafts less readable majority opinions when confronted by an ideologically hostile Congress in order to deter legislative review of their decisions).
Long & Christensen, Winning an Appeal, supra note 17, at 145—46.
Id. at 150–51. The Flesch Reading Ease score is a function of the average number of syllables per word and words per sentence. Id. at 151.
Id. at 155—56.
Id. at 155.
Id. at 156–57.
John Campbell, Writing That Wins: An Empirical Study of Appellate Briefs, 46 Colo. Law., no. 3, Mar. 2017, at 85.
Id. at 87.
Id. at 88 (identifying a “low passive index” and a “high style index” as correlating significantly to an appellant’s win rate in the Ninth Circuit briefs).
Feldman, Counting on Quality, supra note 17, at 45—46.
The first was StyleWriter 4, which measures a variety of variables such as “wordiness, lively language, passivity, and sentence complexity.” Id. at 58. The second was SentiWordNet, a dictionary-based tool used to measure the positive or negative sentiment of each brief. Id.
Id. at 62—66. Feldman also analyzed attorney experience and found a similarly significant positive association with both case outcome and language adoption. Id. at 66—67.
Adam Feldman, Who Wins in the Supreme Court? An Examination of Attorney and Law Firm Influence, 100 Marq. L. Rev. 429, 444 & n.84 (2016) (measuring readability using StyleWriter 4 and SentiWordNet).
Id. at 446.
Paul M. Collins, Jr., Pamela C. Corley, & Jesse Hamner, The Influence of Amicus Curiae Briefs on U.S. Supreme Court Opinion Content, 49 Law & Soc’y Rev. 917, 931 (2015).
Id.
Id. at 932.
Id. at 935.
In both state and federal courts, many more cases are filed in the trial courts than in appeals courts. According to the Court Statistics Project (CSP) — a joint project of the National Center for State Courts (NCSC) and the Conference of State Court Administrators (COSCA), more than 15 million civil actions were filed in state trial courts in 2014. Court Statistics Project, 2014 Civil Case Loads - Trial Courts, http://www.ncsc.org/Sitecore/Content/Microsites/PopUp/Home/CSP/CSP_Intro (reporting data from 46 states plus the District of Columbia and Puerto Rico) (last visited Sept. 29, 2017). In contrast, the same study reported only 259,157 appeals – both civil and criminal – entered in state appeals courts in 2014. Court Statistics Project, 2014 Civil Case Loads - Appellate Courts, http://www.ncsc.org/Sitecore/Content/Microsites/PopUp/Home/CSP/CSP_Intro (reporting data from 49 states plus the District of Columbia and Puerto Rico) (last visited Sept. 29, 2017). In the United States District Courts 281,608 civil actions were filed in the 12-month period ending March 31, 2015. Table C, U.S. District Courts—Civil Cases Commenced, Terminated, and Pending During the 12-Month Periods Ending March 31, 2014 and 2015, http://www.uscourts.gov/statistics-reports/judicial-business-2015-tables (last visited Sept. 29, 2017). But in the twelve months ending September 30, 2015, only 28,550 civil appeals were entered in the United States Courts of Appeals, excluding the Federal Circuit. Table B-3A, U.S. Courts of Appeals—Sources of Civil and Criminal Appeals from U.S. District Courts During the 12-Month Period Ending September 30, 2015, http://www.uscourts.gov/statistics-reports/judicial-business-2015-tables (last visited Sept. 29, 2017).
Because we drew briefs from Westlaw’s database rather than directly from state and federal court dockets across the country, our sample is a convenience sample, and we make no claim that the sample represents each federal and state trial court in proportion to the number of summary judgment motions actually filed. In theory, we could have attempted to gather a stratified sample that included a set number of briefs from every state and federal jurisdiction. The large sample required by such an approach, however, would have far outpaced our resources for this study. Our sample does include briefs from 65 different state and federal jurisdictions, which ensures our sample captures variation across state and federal jurisdictions and is not skewed by reliance on a small number of jurisdictions. Readers are welcome to email the authors to request a copy of our dataset.
Although one of us made several requests to his Westlaw representative, Westlaw did not disclose its process for including briefs in its Trial Court Documents database. The only public description that we found explains, “We have selected filings from trial courts in all 50 states. Trial court-level filings are culled from the most populous counties in each jurisdiction, and include: Cases with heavily-litigated topics, High-value cases, Cases with jury verdicts or settlements. This helps to ensure you’re not wading through irrelevant filings when doing research.” Thomson Reuters, Trial Court Documents, http://thomsonreuters.com/en/products-services/legal/large-law-firm-practice-and-management/trial-court-documents.html (last visited Sept. 29, 2017). Although we cannot rule out the possibility that Westlaw’s brief-selection process skews the population from which we drew our sample in a way that affects the relationship between readability and case outcome, that possibility seems unlikely because there is no indication that Westlaw’s brief-selection process is based in any way on brief readability.
The search query and the protocol for selecting cases appears in Appendix (1).
We excluded reply briefs for three reasons. First, reply briefs are not always filed, and indeed are not always permitted by court rule. Accordingly, we would have gathered fewer complete observations by including reply briefs. Second, reply briefs are likely to vary widely in their length and content, which could affect the readability measures. Finally, we already had a valid observation of the moving party attorney’s writing in the movant’s brief.
If a brief was filed by multiple attorneys, we chose the most senior attorney as the representative under the assumption that the attorney supervised the drafting of the brief and ultimately was primarily responsible for the outcome of the motion.
Removing the citations alleviates the risk that the awkward form of legal citation would undermine the reliability of the readability measures. When we took a small sample of briefs and ran several common readability tests with and without citations, the two sets of readability scores varied wildly and produced significantly different rank-ordering of the briefs.
The SMOG measure, invented by G. Harry McLaughlin in 1969, stands for “Simple Measure of Gobbledygook.” Coleman & Phung, supra note 51, at 84 & n.19 (citing G. Harry McLaughlin, SMOG Grading – A New Readability Formula, J. Reading 639 (May 1969)). For example, the equation for SMOG is 1.0430 * √(polysyllables * (30/number of sentences)) + 3.1291, where polysyllables are words of three or more syllables. The equation for Flesch-Kincaid is 206.835 – 1.015(words/sentences) – 84.6(syllables/words). Strain is calculated by choosing three sentences, counting the syllables in the sentences and dividing by ten. Each metric has its own units of measurement. For instance, SMOG is measured from 1 to approximately 240 with 1 as the easiest possible writing and 240 as the most difficult. Flesch-Kincaid runs from -3.40 to approximately 12 with 12 as the most difficult. For Strain, 5.1 or less is considered easy to read while 15.3 and greater is considered very difficult to read.
For a similar approach to measuring the readability of judicial opinions, see Ryan C. Black et al., U.S. Supreme Court Opinions and Their Audiences 49-51 (2016).
See Robert Cudeck, Exploratory Factor Analysis, in Handbook of Applied Multivariate Statistics and Mathematical Modeling 268 (Howard Tinsley & Steven D. Brown eds., 2000) (“A factor is the combination of all relevant variables in a particular measurement domain”). For other legal studies employing factor analysis to develop composite variables, see, e.g., Ryan J. Owens & Justin P. Wedeking, Justices and Legal Clarity: Analyzing the Complexity of US Supreme Court Opinions, 45 Law & Soc’y Rev. 1027 (2011); Matthew Hiller et al., Measuring Drug Court Structure and Operations: Key Components and Beyond, 37 Crim. Just. & Behav. 933 (2010); Marc J. Stern et al., The Meaning of the National Environmental Policy Act within the U.S. Forest Service, 91 J. Envtl. Mgmt. 131 (2010).
In Stata, once we performed exploratory factor analysis with principal-component factoring, we were left with six readability factors. We then used the predict command for the first factor to generate a score for each brief in our sample. The first factor covered more than 64% of the total variance of the readability measures with an eigenvalue of 32.3, which is more than 23 units greater than the next factor’s eigenvalue. To place this value in context, the two-item factor in Hiller et al., supra note 78, at 940, accounts for less than 50% of the variance with an eigenvalue of approximately 10. Eigenvalues are factors that are derived through linear transformations; increasing values correspond to more useful factors. Our eigenvalue of 32.3 is quite high and is evidence of a robust factor. The readability algorithms that most strongly define our factor are ARI, SMOG, and Danielson-Bryan. ARI, the Automated Readability Index, is a function of characters per word and per sentence. George R. Klare, Assessing Readability, 10(1) Reading Res. Q. 62, 91 (1974-75). SMOG is a function of the frequency of words with more than two syllables. Id. at 79. The Danielson-Bryan formula, the first method designed specifically for computer implementation, is a function of characters per space and characters per sentence. Id. at 76.
See D. Malvern et al., Lexical Diversity and Language Development: Quantification and Assessment 192 (2004).
Westlaw’s divisions for firm and office size are 1, 2-10, 11-25, 26-50, 51-100, 101-250, 251-500, and 501+. See sample Profiler report on file with authors.
Joe Cecil & George Cort, Report on Summary Judgment Practice Across Districts with Variations in Local Rules, Aug. 13, 2008, www.uscourts.gov/file/sujulrs2pdf (last visited Sept. 29, 2017).
Id. at 4.
Id.
Joe S. Cecil, Rebecca N. Eyre, Dean Miletich, & David Rindskopf, A Quarter-Century of Summary Judgment Practice in Six Federal District Courts, 4 J. Empirical Legal Stud. 861 (2007).
Id. at 875.
Id. at 882. They also found that the percentage of civil cases with one or more summary judgment motion granted in whole or in part increased from 6% in 1975 to 12% in 2000, and the percentage of cases terminated by summary judgment increased from 3.7% in 1975 to 7.8% in 2000.
We developed variables and ran models with observations separated by brief as well as by case. The convergent validity of these models provides a robustness check for our results.
Lewis L. Maltby, Employment Arbitration and Workplace Justice, 38 U.S.F. L. Rev. 105, 112—13 (2003) (finding that 60% of federal court employment cases end at summary judgment, with employers winning 98% of those motions, whereas only 15% of state court employment cases end at summary judgment) (citing Inter-University Consortium for Political and Social Research Database, case category 442 jobs (July 11, 1997), http://www.icpsr.umich.edu/index.html (last accessed Nov. 10, 2003)). For additional sources asserting that federal courts grant summary judgment more frequently than state courts, see Howard B. Stravitz, Recocking the Removal Trigger, 53 S.C. L. Rev. 185, 185 n.1 (2002) (“[F]ederal courts are more likely to grant summary judgment to defendants”); JoEllen Lind, “Procedural Swift”: Complex Litigation Reform, State Tort Law, and Democratic Values, 37 Akron L. Rev. 717, 769 (2004) (differing state and federal summary judgment standards “make it much more likely that a defendant in federal court will obtain summary judgment than a defendant in state court”); Kristen Irgens, Wisconsin Is Open for Business or Business Just As Usual? The Practical Effects and Implications of 2011 Wisconsin Act 2, 2012 Wis. L. Rev. 1245, 1262 (2012) (“[F]ederal courts are more conservative as they are more likely to dispose of cases by summary judgment than state courts”); Adam N. Steinman, What Is the Erie Doctrine? (and What Does It Mean for the Contemporary Politics of Judicial Federalism?), 84 Notre Dame L. Rev. 245, 248 (2008) (“As compared to their state brethren, federal courts are widely perceived to be more likely to grant summary judgment against plaintiffs”); Neal Miller, An Empirical Study of Forum Choices in Removal Cases Under Diversity and Federal Question Jurisdiction, 41 Am. U. L. Rev. 369, 438 (1992) (finding that attorneys who removed cases from state to federal court “most often cited summary judgment availability as their reason for removal” to federal court, and that the attorneys perceived “a greater willingness of the federal judiciary to grant summary judgment motions” as well as “organizational impediments limiting the ability of the state court judges to issue summary judgment rulings”).
Cecil et al., supra note 85, at 886—88, Figs. 3 & 5. Cecil’s study provides four categories of summary judgment outcomes: grant in full, grant in part, deny, and “other,” meaning that no action was taken or the district judge accepted the magistrate judge’s report and recommendation without indicating whether the motion was granted or denied. Id. at 886. Because our sample excluded motions seeking partial summary judgment and orders granting partial summary judgment, and because our sample did not include any outcomes similar to Cecil et al.'s “other” category, the percentages we report above from Cecil et al.'s study are limited to the “grant” and “deny” outcomes. If we treat grants in part as moving party successes, defendants in Cecil’s study who moved for summary judgment succeeded 69.4% of the time, and plaintiffs succeeded 48% of the time. Id. at 886, 888, Figs. 3 & 5. However, there is no way to know whether any particular partial summary judgment was “successful” for the moving party. Some partial grants might eliminate one minor claim, while others might cut out the heart of a case leaving little of substance to the litigation.
Cecil & Cort, supra note 82, at 8, Table 3. We calculated their 57% success rate by limiting their data to motions granted in full (9,052) and motions denied in full (6,865). Id. If we treat grants in part (2,914) as moving party successes, moving parties in Cecil and Cort’s study succeeded 63.5% of the time.
JoEllen Lind, supra note 89, at 769—70 (citing 11 states rejecting all or part of the summary judgment standard articulated by the United States Supreme Court under Federal Rule Civil Procedure 56, and noting that differing state and federal summary judgment standards “make it much more likely that a defendant in federal court will obtain summary judgment than a defendant in state court”); J. Palmer Lockard, Summary Judgment in Pennsylvania: Time for Another Look at Credibility, 35 Duq. L. Rev. 625, 654 (1997) (discussing differences between Pennsylvania and federal summary judgment standards).
See Stravitz, supra note 89, at 186 n.1.
See D. Brock Hornby, Summary Judgment Without Illusions, 13 Green Bag 2d 273, 278 (2010) (“State court defendants who believe they have a shot at winning summary judgment frequently remove their cases to federal court if there is jurisdiction. They know that federal courts have more time and resources for these motions than beleaguered state courts.” (footnote omitted)); 1 Steven H. Steinglass, Section 1983 Litigation in State Courts § 8:11 (2015) (“Given these burdens, it is not surprising that better-resourced federal courts have an easier time reviewing summary judgment records and writing opinions granting motions for summary judgment. State trial courts, typically with far heavier caseloads than their federal counterparts, often do not have the time to review thoroughly motions for summary judgment, and state court judges face the temptation of simply concluding that there must be some factual disputes lurking in the voluminous records before them.”).
The method of factor analysis we used was based around principal components, see supra text accompanying notes 78—79, and therefore standardizes the means at 0.
See supra text accompanying notes 90—91.
Logit models are used when testing dichotomous outcomes – in this case, whether the motion for summary judgment was successful or not. Robust standard errors are common in multivariate analysis as they do not assume correlation between error terms and thus are often larger than regular standard errors, which creates a heightened standard for variable significance.
This intra-case comparison is significant because if one party explained the facts more clearly than the other, the difference could make a favorable outcome more likely regardless of whether the individual brief’s readability score was high or low.
As an additional robustness check, we also ran a model (Model 3) that included a single readability measure, ARI (Automated Readability Index), instead of our readability factor variable.
The ARI variable was significant in Model 3 as well providing robustness support for the readability scores we generated using factor analysis. It moves in the negative direction because of the variable’s coding and the fact that the ARI complexity scale moves from least complex to most complex.
One explanation for this difference in state court cases lies in the lower summary judgment success rate in state courts. See supra notes 90—91. Two factors may contribute to that difference. First, different summary judgment standards in some states make summary judgment more difficult to obtain. See Lind, supra note 92, at 769—70; Lockard, supra note 92, at 654. Second, overburdened and under-resourced state court judges may be more likely to deny summary judgment rather than invest substantial time mining a complicated factual record in search of undisputed facts. See Hornby, supra note 94, at 278; Scott Moïse, Drafting Summary Judgment Motions:“What Part of Scintilla Don’t You Understand?” (Part 1: The Motion), S.C. Law., May 2013, at 54, 54 (“After speaking informally with several state court judges, I realized that they are reluctant to grant summary judgment motions except in cases in which the claims are almost to the point of being frivolous.”); Susan Taylor Wall, “No Spittin,’ No Cussin’ and No Summary Judgment:” Rethinking Motion Practice, S.C. Law., May/June 1997, at 29, 29 (describing “[a] sign prominently displayed in in a rural Alabama courthouse [that] reads ‘No Spittin,’ ‘No Cussin’ and No Summary Judgment’”); see also Alex Craigie, Judges “Afraid” of Reversal Are Doing Us All a Disservice, At Counsel Table (Nov. 16, 2012), https://atcounseltable.wordpress.com/2012/11/16/judges-afraid-of-reversal-are-doing-us-all-a-disservice/ (reporting that a retired California state court judge told a CLE audience that “most of his former colleagues on the bench won’t grant a motion for summary judgment, regardless how meritorious the motion may be,” and that the judge cited “‘fear of reversal’ as the biggest reason for this reluctance”). Under such conditions, judges are less likely to be influenced by the readability of either side’s briefs.
We set this spectrum based on the high and low values in our data so that the predicted probability values would be based on the range of readability scores from our data.
The predicted probabilities were derived from Model 1 in Table 3. The solid line in the figure is the graph of predicted probabilities based on the readability score. The dashed lines on the outsides of the solid line represent 95% confidence intervals.
Probit models, like logit regressions, are based on dichotomous outcomes. We use probit models in these regressions because we can run these as multilevel models, which we describe briefly below.
David A. Kenny et al., Dyadic Data Analysis 78—79 (2006). We created unique group identifiers for each pair of observations in each case to run the analyses.
None of the variables reach a significant p-level in the state case model in Table 4.
Figure 2, which is based on Models 2 and 3 in Table 4, was derived similarly to Figure 1 by setting continuous variables to their mean values, dichotomous variables to their modal levels, and ordered variables to their median values, as well as varying the readability score variable from -3 to 3, which is the approximate range of values in our dataset.
The difference between the mean readability levels for moving and non-moving parties are more pronounced at the federal than the state level. At the federal level, the difference is more than double (.59) than at the state level (.29).
See supra text accompanying notes 19—32.
For commentators supporting the theory that poor writing reflects poor thinking, see Irving Younger, Symptoms of Bad Writing, 8 Scribes J. Legal Writing 121, 121 (2002) (“Bad writing goes with bad thinking, and since bad thinking is the source of many of the ills that beset us, lawyers should acknowledge a professional obligation to wage war against bad writing.”); Michael J. Lynch, An Impossible Task But Everybody Has to Do It—Teaching Legal Research in Law Schools, 89 Law Libr. J. 415, 425 n.14 (1997) (“It is difficult to distinguish writing problems from thinking problems. The expression of muddled thinking may give the impression that writing skill is inadequate, but in fact, clear thinking cures many apparent writing problems.”); Lois G. Williams, Professional Development for Litigators, in In-House Training: Maximizing Your Lawyers’ Professional Potential 217, 223 (1994) (“When we speak of a ‘writing’ problem, we usually mean a ‘thinking’ problem. It is not grammar or usage, but rather analytical and organizational, problems that cause trouble.”); Steven I. Friedland, How We Teach: A Survey of Teaching Techniques in American Law Schools, 20 Seattle U. L. Rev. 1, 7 (1996) (“[A]student who appears to have a writing problem may in fact have a thinking problem”).
See supra text accompanying notes 92—94.
See supra text accompanying notes 92—94.
For support of the theory that weaker or flawed arguments “won’t write,” see Wade H. McCree, Jr., Bureaucratic Justice: An Early Warning, 129 U. Pa. L. Rev. 777, 790—91 (1981) (“Every conscientious judge has struggled, and finally changed his mind, when confronted with the ‘opinion that won’t write.’”).
See supra Table 3. Our logit model did show a significant correlation between repeat player status and summary judgment success, although that significance disappeared when we controlled for non-moving party repeat player status. See id. Our multilevel probit model, however, did not show a significant correlation between moving party repeat player status and summary judgment success. See supra Table 4.
In Appendix (2) we provide additional statistics showing that in our federal court sample, moving-party lawyers enjoy greater advantages in resources, repeat appearances before the motion judge, and overall experiences than in our state court sample. However, there were no statistically significant combinations of the individual experience and resource variables.
This correlation breaks down to .08 for the federal court sample and -.01 for the state court sample, implying that more experienced state court attorneys wrote slightly less readable briefs in our sample population.
See supra Table 3. These repeat-player results are similar to Feldman’s findings of a repeat-player advantage at the Supreme Court level. See Feldman, supra note 63, at 448.
See Richard C. Wydick, Plain English for Lawyers, 66 Calif. L. Rev. 727, 727 (1978) (noting that Thomas Jefferson lamented in 1817 that lawyers drafting statutes were accustomed to “making every other word a ‘said’ or ‘aforesaid,’ and saying everything over two or three times, so that nobody but we of the craft can untwist the diction, and find out what it means”) (quoting Letter to Joseph C. Cabell (Sept. 9, 1817), reprinted in 17 Writings of Thomas Jefferson 417—18 (A. Bergh. ed., 1907)).
Richard C. Wydick, Plain English for Lawyers (5th ed. 2005).
Id. at 7—39. “Base verbs” are simpler and require fewer words. This sentence uses a base verb: “The defendant objected.” This sentence does not: “The defendant raised an objection.” See id. at 23—24. In other words, avoid nominalizations. See Lisa Mazzie Hatlen, Conciseness in Legal Writing, Wis. Law., June 2009, at 21, 23.
Wydick, supra note 119, at 56—58.
See, e.g., Amanda Shofner, 6 Automatic Editing Tools That Will Make Your Writing Super Clean, The Write Life (Sept. 1, 2016), https://thewritelife.com/automatic-editing-tools/ (identifying such tools as grammarly.com, prowritingaid.com, afterthedeadline.com, autocrat.com, hemingwayapp.com, and wordrake.com).
See Marc Galanter, Why the “Haves” Come Out Ahead: Speculations on the Limits of Legal Change, 9 Law & Soc’y Rev. 95, 103—04 (1974) (observing that litigation favors the “haves” over the “have nots”); accord Albert Yoon, The Importance of Litigant Wealth, 59 DePaul L. Rev. 649, 654—55 (2010) (“The intuition here is that the party who incurs more legal expenditures gets better legal representation, either in terms of quantity (more units of representation), quality (higher level of representation), or perhaps both.”).
See, e.g., Anderson & Heaton, supra note 1, at 157 n.6 (citing numerous studies involving defense counsel).
See Yoon, supra note 123, at 661 (reporting that federal judges hearing civil cases ranked intellectual property and commercial litigation attorneys as providing the highest quality representation and family and immigration law attorneys as providing the lowest quality representation, and noting that the rankings are roughly consistent with relative attorney salaries in those practice areas).