
- Introduction
- I. Decision Readability Matters and Is Worth Measuring
- II. The Limits of Early and General-Purpose Readability Formulas
- III. Empirically Finding Law’s Own Readability Formula
- IV. Discussion: MADRS – A New Law-Specific Readability Formula
- A. MADRS Includes Variables That Are Consistent with Readability Theory
- 1. Kuperman Age of Acquisition (Content Words) / AoA_CW
- 2. Medical Research Council – Imageability (All Words) / MRC_Image_CW
- 3. General Inquirer Database – Legal (Nouns) / GI_Leg_Nouns
- 4. COCA – Spoken (Proportion of Trigrams in the Top 30K) / COCA_Spoken_TriTop30K
- 5. Dependents / Nominal (No Pronouns, Standard Deviation) / Nominal_Deps_NN_StDev
- 6. Medical Research Council – Concreteness (Function Words) / MRC_Concr_FW
- B. MADRS Is Length-Independent
- C. MADRS Is Minimally Vulnerable to NLP Parsing and Tagging Errors
- D. MADRS Justifiably Excludes Certain Variables from the Formula
- A. MADRS Includes Variables That Are Consistent with Readability Theory
- V. MADRS Applied: The Readability of SCC Opinions from 2022
- Conclusion – MADRS: Law’s Own Comprehensive Readability Formula
- Appendix
Introduction
Modern democratic societies generally recognize the value of the rule of law,[1] and a primary requirement of the rule of law is that law “must be capable of guiding the behaviour of its subjects.”[2] Legal theorists and commentators seem to widely accept the idea that people should be able to figure out what the law requires of them.[3] Case law is not exempt from this principle: “Writing is the conduit through which courts engage with the public. As such, the quality of judicial writing is an important element of the legal system—it determines the clarity of the rules that we live by.”[4] In other words, case law should be communicated in a way that facilitates understanding by the people who might be affected by, or interested in, the law that it addresses. And yet, as Professor Ryan Whalen notes, we have very little empirical information about the readability levels of judicial decisions,[5] and this information tends to relate only to the Supreme Court of the United States,[6] or to other localized courts.[7]
The problem with this lack of information about readability levels is that we have good reasons to suspect that judicial decisions are not easily understandable to ordinary people. An abundance of research indicates that legal language is difficult for most non-lawyers to understand.[8] And since these decisions state, or explain, or clarify what the law means—for the parties, future litigants, and the population more generally—a lack of readable language within the decisions suggests that large swaths of people cannot understand at least some elements of the law that applies to them, and that they are expected to follow. This scenario is particularly problematic in an environment where the need to understand the law without assistance from a lawyer is more than just hypothetical. Recent research shows that self-represented (or pro se) litigants now appear in approximately 80% of cases in California family court,[9] and 62% of cases before Canadian administrative tribunals.[10]
Beyond these practical considerations, there are compelling normative arguments for why case law must be readable to ordinary people.[11] Some scholars even suggest that judges have a “democratic duty”[12] to produce understandable decisions: “When opinions are not written in a way that makes them accessible to the general public, the Court fails in its fundamental obligation, not only to ‘say what the law is,’ but to do so in a way that is intelligible to citizens.”[13] If all members of the population have a right and a legitimate expectation to be able to evaluate the work performed by their courts, and the outcomes of decisions from these courts, then the readability levels of court decisions is a significant issue that merits study.
This Article takes a necessary first step in allowing us to develop new and reliable data about the readability levels of adjudicative decisions. It describes the creation of a quantitative linguistics tool that measures the readability of Canadian court and tribunal decisions, and that could measure the readability of other legal documents that contain similar kinds of language.[14] The tool—Madden’s Adjudicative Decision Readability Score, or MADRS—is the product of an original empirical study that relies on expert-generated readability scores of real extracts from adjudicative decisions as its foundation. For decision-writers, and for anyone else who cares about the extent to which court and tribunal decisions are likely to be understood by their audiences, this Article provides a description of—and justification for—the MADRS formula. Although the Article primarily reports on the empirical study that led to the MADRS formula, the implied argument throughout this Article is that it is now both possible, and worthwhile, to measure the readability levels of adjudicative decisions, for a variety of individual and collective reasons. Readability results for law-specific texts like judicial decisions can now be calculated in seconds, using a free online calculator found at www.readabilitytools.com.
Part I of this Article highlights an emerging interest in the production of readable decisions from scholars and others within the court and tribunal systems, particularly in Canada. Part II notes some previous efforts at measuring decision readability levels but explains why older and generic readability formulas are not ideal for measuring the readability of adjudicative decisions written in law’s unique language. Part III describes the methods and results of the Article’s original empirical study that creates and validates the MADRS formula and describes how the formula is calculated to produce readability scores for decisions. Part IV puts the MADRS formula into context by asserting its theoretical and statistical validity while acknowledging its limitations. Part V illustrates one of the many ways in which the formula can be used to produce and analyze readability data, by arguing that the readability-level differences of Supreme Court of Canada opinions released by each judge in 2022 can be explained in terms of how the different judges see their audiences. I conclude with suggestions for future applications of the MADRS formula.
I. Decision Readability Matters and Is Worth Measuring
Adjudicative decisions represent the most significant, and typically the only, communicative output from the judges or tribunal members whose decisions affect the rights, obligations, privileges, and duties of ordinary people within their jurisdictions.[15] Written decisions are valuable for the sake of transparency and accountability, and they may contribute to the overall quality of the decision that is being made.[16] Although we do not know the extent to which parties actually read the decisions that dispose of their cases across all courts and tribunals, at least some evidence suggests that parties will read their entire decisions. A survey of claimants whose cases were decided by Canada’s Social Security Tribunal revealed that 87% of claimants read the whole decision; 7% read most or some of the decision, and 6% read very little or none of the decision.[17] These statistics present a compelling case for decision-makers to consider the reading competency levels (commonly measured in terms of a person’s reading grade level, or by reference to some other educational benchmark)[18] of the parties before them when writing their decisions.
Judges seem to acknowledge that they should write readable decisions. They repeatedly profess to be communicating, in their decisions, with everyday members of the public.[19] This is true at all levels from the Supreme Court of Canada (“SCC”),[20] to Courts of Appeal,[21] to Superior (trial-level) Courts.[22] Administrative tribunals similarly seem to have a lay audience in mind for their decisions: “You should be writing for the average person appearing in front of you. Assume that your reader is generally well-informed but without specialized training in the area being written about.”[23]
Until recently, no Canadian courts or administrative tribunals made public efforts to establish readability targets for their written products, or to measure actual readability levels for their decisions. In 2018, however, Canada’s Social Security Tribunal (“SST”) began training its administrative decision-makers to write in more plain language, as part of an effort “to make all aspects of the Tribunal’s practices more accessible to Canadians.”[24] The Chair of the Tribunal “set a reading target of grade 9 for all decisions”[25] based on the Flesch-Kincaid Grade Level readability formula, which scores a text for difficulty based on the average number of words per sentence and syllables per words.[26] A subsequent study of the Tribunal’s decisions found “that 32% (n=60) met that target and a further 33% (n=62) followed closely at grade 10,”[27] which illustrates that more than two thirds of the tribunal’s decisions were not achieving the Chair’s readability target.
The British Columbia Civil Resolution Tribunal (“BC CRT”), another administrative tribunal that functions much like a small claims court, also strives to ensure that its written products are readable to a large audience. As the then-Chair of the BC CRT explained in 2019:
Everything at the CRT, from the website, to the Solution Explorer (our expert system), to our emails and forms, to the final decisions, is written at about a grade 6 reading level. To do this, we train our staff and members on how to write in plain language, and we audit our writing using online accessibility assessment tools. We also test everything we develop with community legal advocates who represent those with the highest barriers to accessing justice.[28]
The BC CRT’s target grade level for its written products is not surprising; the Chairperson who articulated the target, Shannon Salter, has elsewhere referred to research showing “that public health information needs to be written at a grade 6 reading level to be widely understood,”[29] and has argued that, “[w]ith equally complex jargon and processes, public legal information must be written at a similar level.”[30]
Notwithstanding these examples that involve concrete measurements of, or steps to enhance, readability, the most suitable metaphor for describing today’s decision-readability landscape is probably that of a road paved with good intentions. There seems to be a strong desire to produce readable decisions.[31] But no Canadian court or administrative tribunal other than the BC CRT and the SST has publicly declared how they measure readability, or whether they are meeting their readability targets; this silence leaves the impression that readability goals from these institutions are nothing more than vague, abstract ambitions. Furthermore, even when a court or tribunal might want to measure readability levels for their decisions, there has not been (until now) a law-specific readability formula for them to use. They have been limited to using general-purpose readability formulas, created for tasks like assessing the grade levels of texts written for students,[32] or other non-legal texts.[33]
To be clear, this Article does not propose equal and high readability levels for all adjudicative decisions; there are at least some decisions that must reach only a small and sophisticated audience.[34] Rather, this Article implicitly encourages judges and tribunal members to write decisions so that their audiences can best understand them, while recognizing that the reading abilities of their audience members will often be different from one decision to the next. Uniform and rigid readability targets, like the ones mentioned in the preceding paragraph, are perhaps too indiscriminate to achieve readability levels optimized for both efficiency and comprehension. A more nuanced and audience-centric approach is arguably preferable.
To the extent that courts and tribunals (other than the BC CRT and SST) have readability goals of any kind, they may not yet have formulated strategies to achieve these goals. These institutions may simply be unaware of the potential mechanisms and paradigms that exist, or that could be developed, to accomplish such measurements. But this silence from most Canadian courts and administrative tribunals about measuring (and therefore potentially ensuring) decision readability levels may also be the result of deliberate choices not to measure readability, perhaps in recognition of Goodhart’s Law, which warns of the dangers of allowing measurements to become performance targets.[35] Choices not to measure readability may also flow from a perceived lack of resources or time to devote to the task in the face of competing priorities for the relevant courts and tribunals. Or these choices may flow from a sense that it is inappropriate, or a violation of judicial independence, to look behind (or to make suggestions to change) the way that judges write their decisions.[36]
Regardless of the reasons for our current lack of information about how readably Canadian courts and administrative tribunals write their decisions, this Article identifies a tailor-made quantitative readability approach that future decision-writers can use to assess how well their audience might understand their decisions. If judges and tribunal members believe—as they seem to—that they should be writing understandable decisions, then this Article gives them a means to verify whether they are accomplishing their objectives, in the form of the MADRS formula that is described below.
II. The Limits of Early and General-Purpose Readability Formulas
Before going further, it would be useful here to clarify the meaning of the term “readability formula.” A readability formula is a tool designed to quantitatively assess a text based on linguistic properties that the text contains, to predict how well a generic reader might understand the text.[37] There are two related (but distinct) quantitative dimensions associated with readability formulas. First, the assessments depend on quantitative measurements of different language properties that a text contains; and second, the measurements are ultimately expressed in quantitative form on a scale of some sort, indicating whether more or fewer people are likely to understand the text.[38]
One might initially think that an off-the-shelf solution to this problem of measuring the readability of adjudicative decisions ought to already exist. After all, many general-purpose readability formulas have been developed over the last 100 years, each with subtly different components, strengths, and weaknesses. For instance, in 1948, Rudolph Flesch developed the “Flesch Reading Ease” formula that relied on only two variables (average syllables per 100 words and average words per sentence), to score the readability of texts on a scale of 1 to 100.[39] Flesch created the formula from the McCall-Crabbs Standard Test Lessons in Reading, which are short reading comprehension passages and associated comprehension questions for students between grades 2 and 12.[40] Flesch established the grade level for each text based on a requirement that students in a particular grade be able to correctly answer 75% of the comprehension questions.[41] Shortly afterward, Drs. Edgar Dale and Jeanne S. Chall produced a readability formula based only on average sentence length, and on the ratio of words that did not appear on their list of approximately 3,000 common words.[42] They also used the McCall-Crabbs Standard Test Lessons in Reading to create their formula, but they required students to correctly answer only 50% of the comprehension questions to establish the grade level for each text.[43] The Flesch-Kincaid Grade Level formula was created in 1979, from a collection of eighteen text extracts drawn from American military training manuals.[44] This formula relies on measurements of average words per sentence and syllables per word. More recently, Scott A. Crossley, Stephen Skalicky, and Mihai Dascalu created the Crowdsourced Algorithm of Reading Comprehension from a selection of Wikipedia articles that crowdsourced raters read and ranked based on relative reading difficulty levels.[45] This formula uses a combination of thirteen linguistic variables relating to lexical (word) sophistication, cohesion, sentiment, and multi-word phrase properties.[46]
However, even though scholars have relied on the earlier formulas in some studies that measure the readability of legal texts,[47] and texts from other disciplines,[48] these formulas are now somewhat dated, do not necessarily reflect our current behavioral and theoretical understanding of the reading process, and do not perform as well as more contemporary formulas.[49] Additionally, none of the earlier formulas were created from, or for use on, law-specific texts.
Even the more recent and sophisticated general-purpose readability formulas that were created from non-specialized texts are probably not suitable for assessing the readability of texts from within a specialized domain. A recent study from the medical field illustrated that three general-purpose readability formulas were not accurate in predicting the human-perceived reading difficulty of electronic medical record documents[50] that are “full of medical jargon, abbreviations, and other domain-specific usages and expressions that are ill-suited for the lay people (patients).”[51] As this research suggests, the unique language within specialized domains may present barriers to readability that traditional readability formulas simply do not account for: short medical abbreviations skew formulas toward higher readability levels, but they are unfamiliar—and can be incomprehensible—to patients.[52]
At a foundational level, the problem with using general-purpose readability formulas on specialized texts stems from major language differences between the texts that were used to create the formulas and the specialized texts upon which we might try to apply the formulas. These formulas all tend to be created through the statistical technique of regression analysis.[53] A grade level or other text difficulty measure is established for the reference (or formula-creating) texts using human participants; then, researchers quantify different elements of the language within each reference text; finally researchers use regression analysis to create a predictive formula using different weights for the most influential language variables that are associated with text difficulty in the reference texts.[54] But the predictive power of a readability formula generated from one type of document may weaken when the formula is used to evaluate another type of document with different language properties.[55] Regression formulas are most reliable when used on new data that falls within the same range as the original data that served as the foundation for the formula.[56] For instance, if the documents that were used to create the Flesch Reading Ease formula (which is calculated based on average word and sentence lengths)[57] had average sentence lengths of between four and thirty-five words, then the formula would not necessarily be reliable in predicting the readability of documents with much larger average sentence lengths of between thirty and ninety words. The use of regression formulas on data that falls outside of the scope of the formula’s original data is called extrapolation, and the predictive unreliability of such formulas when used for extrapolation is well-recognized by statisticians: a regression formula’s output may be biased or imprecise when extrapolating and may become even more so depending on the size of any data differences between the original and the subsequent data sets.[58]
To mitigate against this inherent limitation associated with regression formulas when used beyond their original purposes, healthcare researchers have proposed new approaches for deriving readability formulas in their fields. For instance, expert raters (such as “health literacy and clinical experts and a patient representative” in one study,[59] and raters with “an advanced degree, experience teaching literacy-based classes, expertise in medical discourse, and prior experience rating medical text samples” in another study)[60] have been used to generate human measurements of the readability of a body of specialized texts, so that the texts and their associated linguistic properties could subsequently be used to generate new quantitative readability formulas. By using domain-specific readability formulas, these researchers can likely predict the readability of documents in their fields with far greater accuracy than was possible using general-purpose formulas.
Legal English is problematic, from a readability formula perspective, for many of the same reasons that medical language is problematic. Legal English is characterized by technical, archaic, Latin, and French terms,[61] and it “frequently adopts ordinary words but gives them a specific legal meaning that laypersons might never guess.”[62] In addition, legal English has some characteristics not found in either medical or ordinary English (e.g., formality, impersonality, the use of conditional phrases, and parallel structures)[63] that might further contribute to making this form of language less comprehensible to lay readers,[64] and in ways that might confound general-purpose readability formulas.
As the above discussion indicates, a legal domain-specific approach would likely be the most appropriate way to assess the readability of Canadian court and administrative tribunal decisions. One could perhaps bypass the formula approach altogether and simply rely on real-world human comprehension testing for every court decision or other document for which one wants a readability assessment. But this approach would be time-consuming and costly to implement. The advantage of a formula-based approach is that it only requires human-generated comprehension scores for an initial set of texts that are used to make the formula—after which, the formula can be applied without further involvement of human test subjects. Thus, a new formula generated from a reference corpus of legal texts might be needed.[65] But up until now, no one has specifically tested how well general-purpose readability formulas perform on law-specific texts, or whether a new law-specific formula might outperform the existing general-purpose formulas. One of the major undertakings of this Article is therefore to identify the most appropriate tool for assessing the readability of judicial and administrative tribunal decisions by comparing the performance of MADRS—a new law-specific readability formula—against existing general-purpose formulas on a group of adjudicative decision texts.
III. Empirically Finding Law’s Own Readability Formula
In general terms, the study that this Article reports on proceeds as follows. I first establish “gold standard” (that is, human-generated) assessments of the readability levels of a corpus of documents that have similar linguistic properties to real Canadian court and adjudicative decisions, by having human experts score these documents for readability.[66] Next, by splitting a data set of scored documents into two groups, I use one sub-group of the data to derive a new law-specific readability formula. Then, I calculate quantitative readability scores for every document within the second sub-group of documents, using both my new law-specific readability formula, and six other existing general-purpose readability formulas. I then assess the correlations between the scores produced using each of these formulas, on the one hand, and the “gold standard” scores that were actually assigned by my human raters, on the other hand, to identify which formula’s scores most strongly correlate with the “gold standard” scores. In this way, I select the best formula for further use based on its ability to quickly and easily assign readability scores to adjudicative decisions texts, where these scores are strongly associated with scores that a real human would be expected to assign to the same texts. My approach parallels established methods that have consistently been used by applied linguists to create readability formulas over the last century.[67]
A. Step 1 – Establishing “Gold Standard” Readability Scores
The process through which I developed and validated human-generated readability scores for text extracts from Canadian court and tribunal decisions is described below. Broadly speaking, this process involved the following steps: selecting a group of texts to be scored; identifying expert and lay raters who would score the texts; generating scores for each text from the two types of raters; and assessing the scores for validity and reliability.
1. Method: Building a Corpus and Obtaining Readability Scores
In order to generate benchmark readability scores for adjudicative texts, I follow a method that represents a blending of the methods used by Crossley, Skalicky and Dascalu in creating their general-purpose Crowdsourced Algorithm of Reading Comprehension (CAREC) readability formula,[68] the methods used by Scott A. Crossley, Renu Balyan, Jennifer Liu, Andrew J. Karter, Danielle McNamara and Dean Schillinger, in creating their healthcare-specific Model of Text Readability in Physicians readability formula,[69] and the methods used by Sasikiran Kandula and Qing Zeng-Treitler in their comparison of expert readability measurements with classic readability formula measurements for healthcare-related texts.[70] I do this by: (1) building a diverse body of texts for my experts to score; (2) obtaining expert readability scores for each text; and (3) obtaining “lay” (i.e., ordinary or non-expert) readability scores for each text. At the end of this process, I have a discrete readability score (based on the average of expert scores) for each document within my “gold standard” corpus of adjudicative decision text files.
Build the Corpus of Reference Texts. My method involved the creation of human-generated readability measurements for a reference corpus of law-specific texts, consisting of excerpts from judicial and administrative tribunal decisions that were published in 2021. Readability research suggests that stylistic variations tend to occur over time, and hypothesizes that texts that may have been more readable to audiences at the time when the texts were first published are less readable to today’s audiences.[71] To facilitate future readability studies of contemporary adjudicative decisions, my reference corpus therefore consists of texts that were recently published, in 2021.
I built a corpus of 375 text files,[72] where each file contained approximately 600 words. This corpus contains fewer files than the 600 files that were used by Crossley, Skalicky and Dascalu,[73] and fewer than the 724 files that were used by Crossley, Balyan, Liu, Karter, McNamara and Schillinger.[74] However, it contains a total of 233,527 words, which is more than the approximately 120,000 words within Crossley, Skalicky and Dascalu’s corpus,[75] and more than the approximately 213,500 words in Crossley, Balyan, Liu, McNamara and Schillinger’s corpus.[76] Based on the number of words and files within my corpus, I determined that its size was sufficient for my purposes. Additionally, based on a related study from a slightly different context,[77] my expectation was that by using relatively longer texts (albeit within a corpus containing a lower number of texts) than some others had recently used in conjunction with Natural Language Processing techniques to derive readability formulas, I would be in a better position to assess correlation strengths between linguistic features in these texts and the overall readability levels of the texts.
To generate a corpus that encompasses a wide range of the types of decisions that make up Canadian case law as a whole, I ran thirteen different search queries[78] using the CanLII database,[79] and then selected randomly from the results of each query to identify decisions that would contribute to my corpus.
I have kept a complete history of my search and case-identification techniques on file, but describe this technique here for two of my thirteen queries (i.e., for my queries intended to ensure that I had diverse legal subject areas within my corpus, and a minimum number of appellate decisions), for the sake of illustration:
Diverse Legal Subject Areas
-
Search text = “law”;
-
Time = 2021;
-
Tribunal = all courts and tribunals;
-
Filter subject = business; insurance; IP; international; property & trusts; taxation;
-
Sort by “most pages”;
-
Take every tenth decision until thirty decisions have been identified.
Ensure Minimum Number of Appellate Court Decisions
-
Search text = “law”;
-
Time = 2021;
-
Tribunal = All appeal courts;
-
Sort by “newest”;
-
Take every tenth decision until forty decisions have been identified.
For each decision that was identified based on my search queries and selection processes, I then opened the decision, and quasi-randomly[80] selected a passage of approximately 600 words of text from within the decision. This text size exceeds the length used by both recent and older previous studies in developing readability formulas,[81] so I determined that it would provide me with texts of suitable length for this study. I then copied-and-pasted the selected text into a blank plain text file.[82]
Obtain Expert Readability Scores for Each of the Reference Texts. Like Crossley et al.[83] and Kandula and Zeng-Treitler,[84] I decided to rely upon panels of expert raters to generate my “gold standard” human readability assessments using a Likert Scale. Using expert raters offers several benefits, but a major advantage of this approach is that it allows a researcher the ability to rapidly and efficiently rate a large number of texts,[85] especially when compared to an approach that attempts to more directly measure a particular person’s comprehension of a text that they have just read through, for example, short answer or fill-in-the-missing-word questions about the text. Even scholars who opt to use other methods for generating readability scores on a reference corpus (like Orphée de Clercq, Veronique Hoste, Bart Desmet, Philip Van Oosten, Martine De Cock and Lieve Macken, who used a non-expert, crowd-sourced approach alongside an expert approach within their study) concede that using expert scoring is the “gold standard.”[86]
There is also a growing consensus that subjective approaches to scoring the readability of texts is preferred.[87] DeClercq et al. suggest that the typical way to generate these human scores is “to let people assign absolute scores to each text and use the resulting mean readability score.”[88] I adopted this approach for the process described within this Article.
My objective was to select as expert raters a small group of individuals who had both legal expertise and experience, and some additional expertise about the needs and capabilities of the parties to legal disputes. I succeeded in recruiting the following six experts: three legal aid staff lawyers, one federal tribunal member, one provincial tribunal member, and one law (reform) commission lawyer (who had deep access-to-justice experience in his current role, as well as several years of legal aid experience in a previous role). Each of these experts has multiple post-secondary degrees (including at least one law degree) and legal practice experience. All experts also have extensive experience in working with participants in the legal system who have varying degrees of legal sophistication and legal literacy. I relied on this combination of each person’s own ability to understand law at its highest level of complexity (based on the person’s education and professional practice experience), together with their experiences in helping less sophisticated users of the legal system to understand and access law, to establish these individuals as expert raters for the purposes of my study.
This approach to identifying and selecting experts is consistent with approaches that others have used in the past. For instance, DeClercq et al. used a combination of thirty-six teachers, writers, and linguists as expert readability raters for texts of different genres (e.g., administrative texts, news articles, and miscellaneous others).[89] Crossley et al. used a large group of teachers who had been recruited by email as expert raters for scoring a corpus of texts commonly found in the kindergarten to grade 12 classroom environments, from both informational and literary genres.[90] Kandula and Zeng-Treitler used the following experts to rate the readability of health-related literature: “a health literacy consultant with extensive experience in content development and health communication education, a health communication researcher with background in education psychology and nursing, a patient education content developer and nurse, a practicing nurse and certified diabetes educator, and a librarian from a hospital-based consumer health library.”[91] And Quinten Steenhuis, Bryce Willey and David Colarusso used “expert reviewers who variously work in the field of plain language, participate in form committees, and regularly work with self-represented litigants” in their study that assessed the usability of court forms.[92]
As these examples illustrate, expert raters may acquire their expertise through experience with language or teaching (for general-purpose texts or texts drawn from multiple fields), but they may also acquire their expertise by having a heightened understanding of both the specialized subject of the text, and of the challenges that readers of this text might face (for specialized, technical, or discipline-specific texts). My expert raters fall into this latter category, in that they have law-specific expertise—particularly with respect to the needs of self-represented and legally unsophisticated users of the legal system—for scoring the readability of law-related texts.
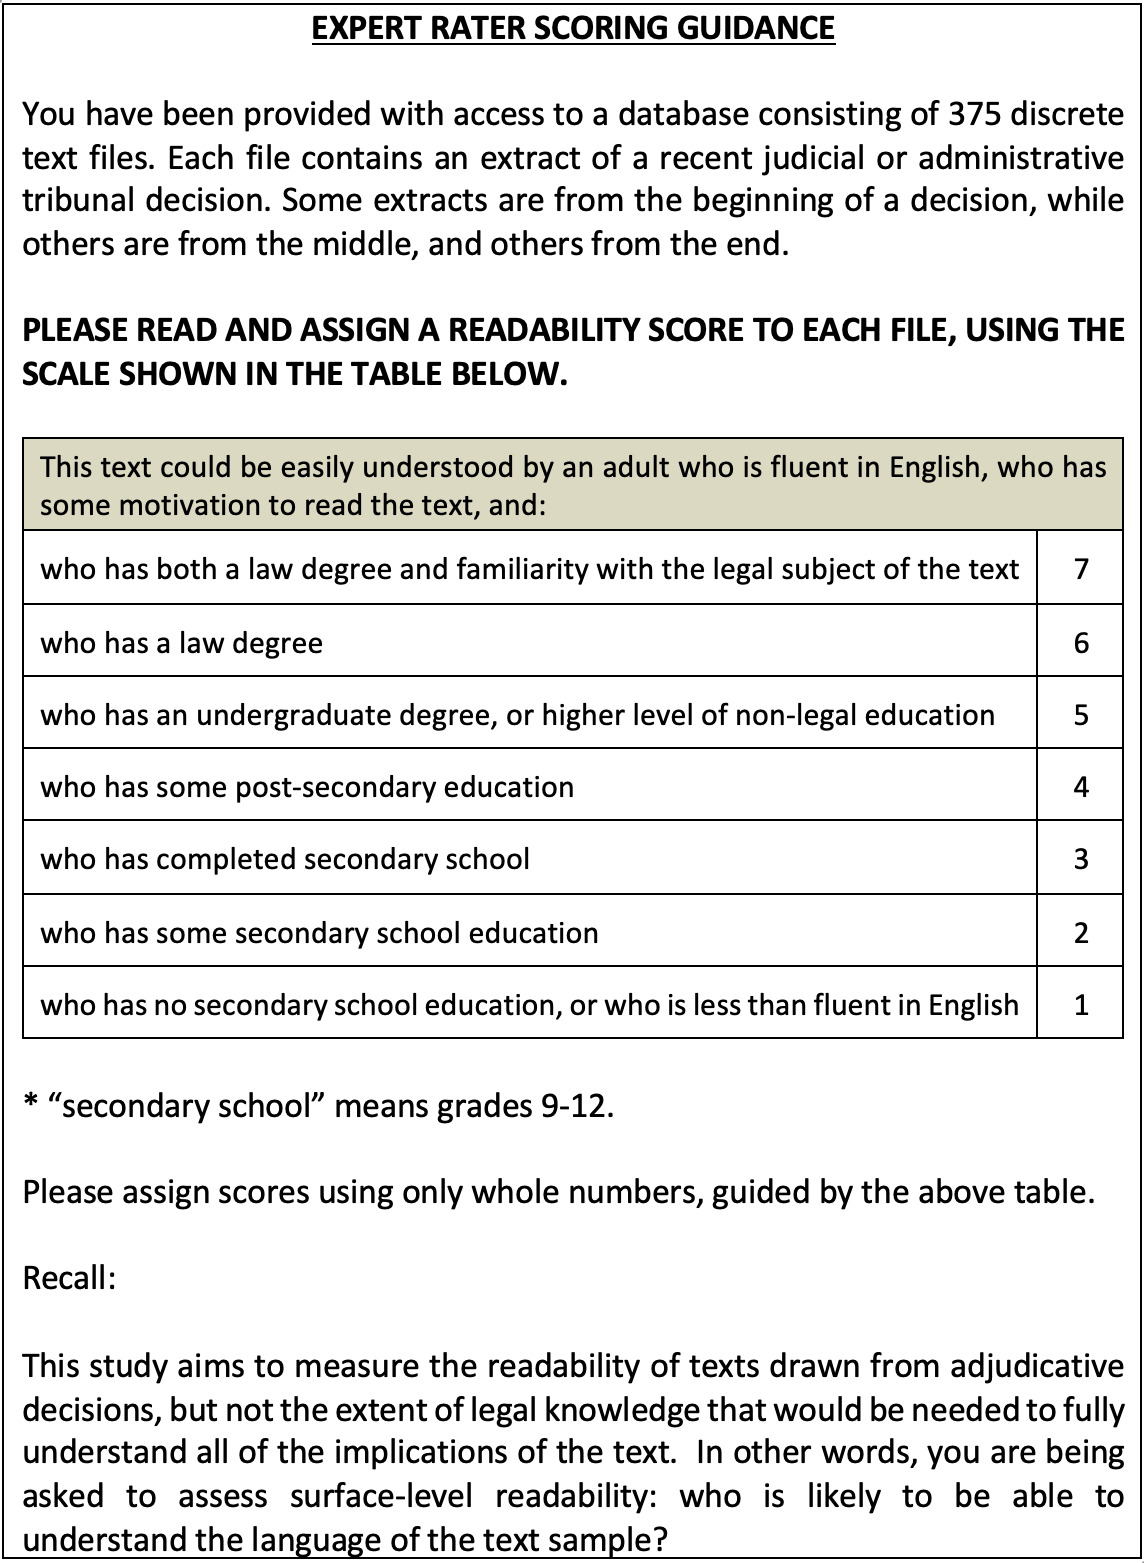
Once the experts had been identified, I conducted a collective training and mock scoring exercise. There was widespread agreement (less than a two-point scoring variation across the six experts for each file) about how each file should be scored. On this basis, I determined that the experts were ready to independently score each of the 375 files in my corpus. The experts then commenced their independent scoring, based on the scoring guidance provided below in Figure 1.
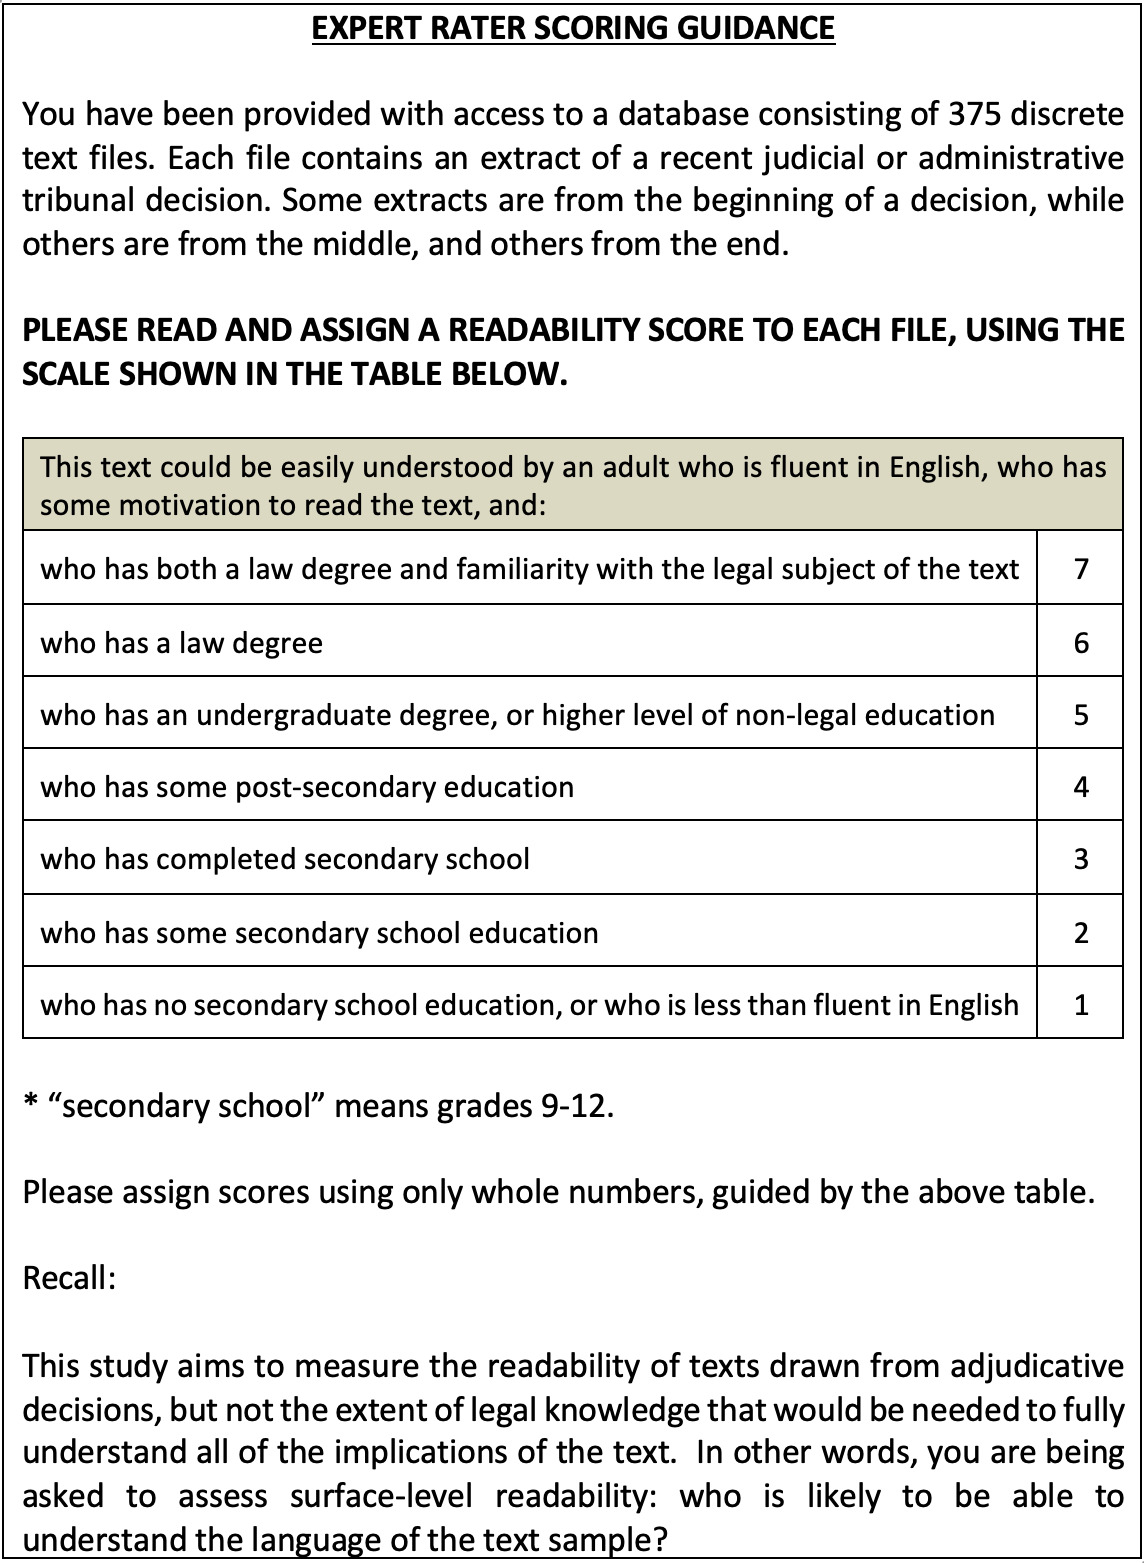
Obtain Lay Readability Scores for Each of the Reference Texts. Although my method involved using expert scores as the ultimate “gold standard” measurement of readability for each text within my 375-file corpus, I also used non-expert raters who produced scores that allowed me to assess the validity of the expert ratings when compared against non-expert ratings. The idea of using non-expert raters alongside expert raters follows the method used by Kandula and Zeng-Treitler, who used a patient advocate (a person whose family member had diabetes) to score a subsection of files that had also been scored by experts, and who found that the correlation between the patient scores and the expert scores “provided an extra validation to the experts’ rating.”[93]
I selected a group of twelfth grade students as lay raters, since people at this education level would fall close to the middle of the education range that is captured within my seven-point scoring scale that the expert raters were using. These individuals were therefore in an ideal position to provide a non-expert assessment of whether a text was understandable to a person with approximately their education level, or a substantially higher or lower education level.
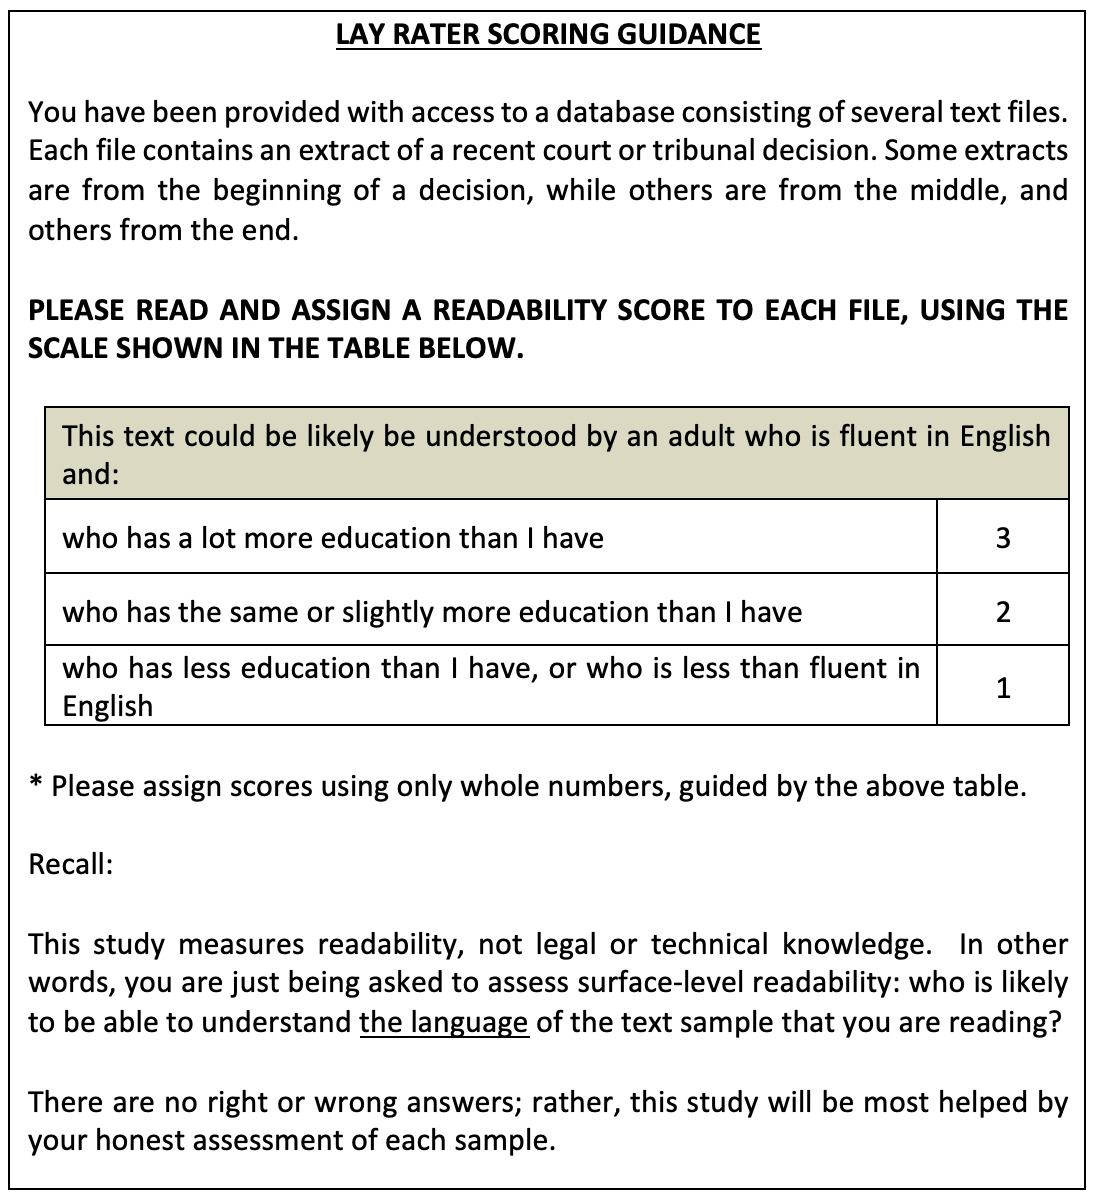
I successfully recruited eighteen students[94] who were in grade 12 and who were willing to volunteer between three and nine hours of time to score files. I conducted two one-hour scoring calibration sessions (where each student volunteer attended one of these sessions) to discuss scoring of the sample files using the scoring guidance document and to answer any questions from the students. At the end of these meetings, the students showed sufficient understanding of the scoring task that they were ready to independently score their respective files. The students then commenced their independent scoring, based on the guidance contained below, in Figure 2.
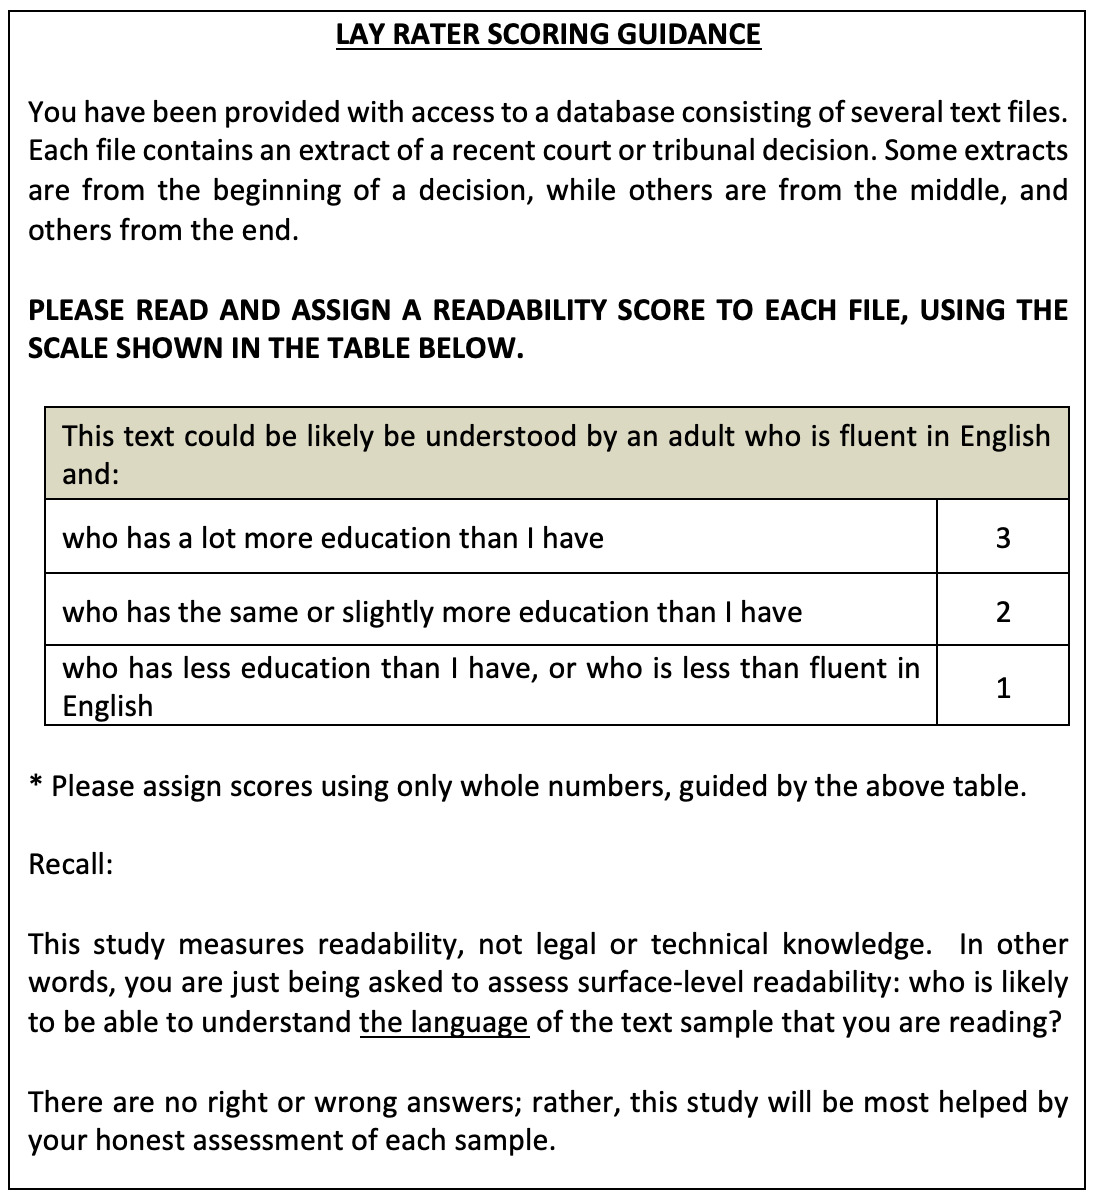
2. Results – Analyzing the “Gold Standard” Readability Scores
After obtaining both expert and lay scores for each document within my 375-file corpus, I assessed the results of these scoring processes to determine whether I had sufficiently reliable and valid data for the purposes of this study. Based on an internal consistency measure of high inter-rater reliability (between expert raters) and on strong correlations between the experts’ and lay raters’ scores, I concluded that the data was both reliable and valid.
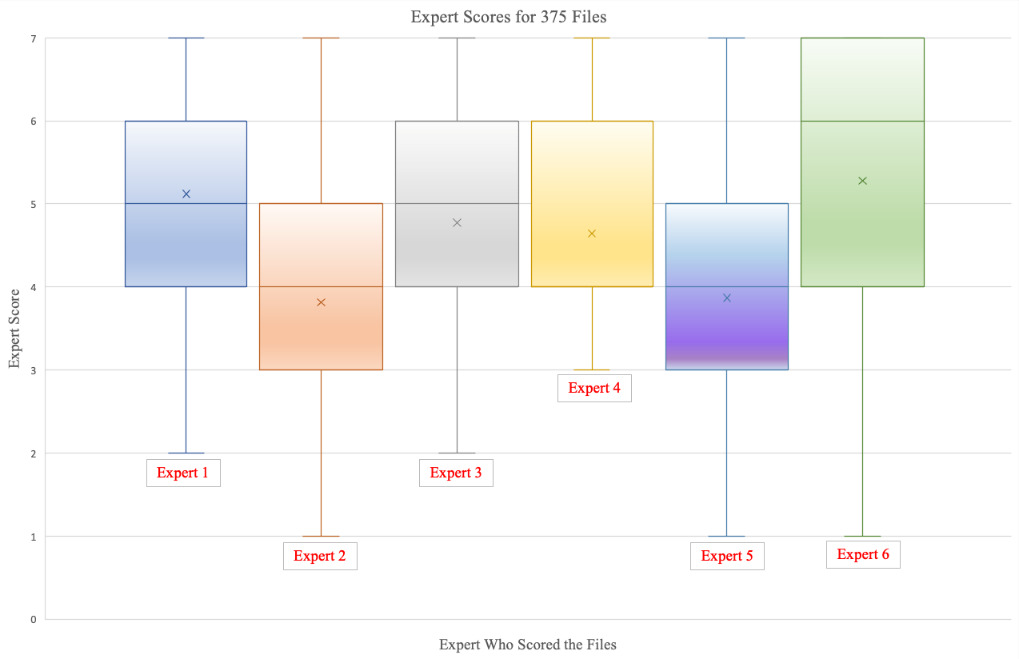
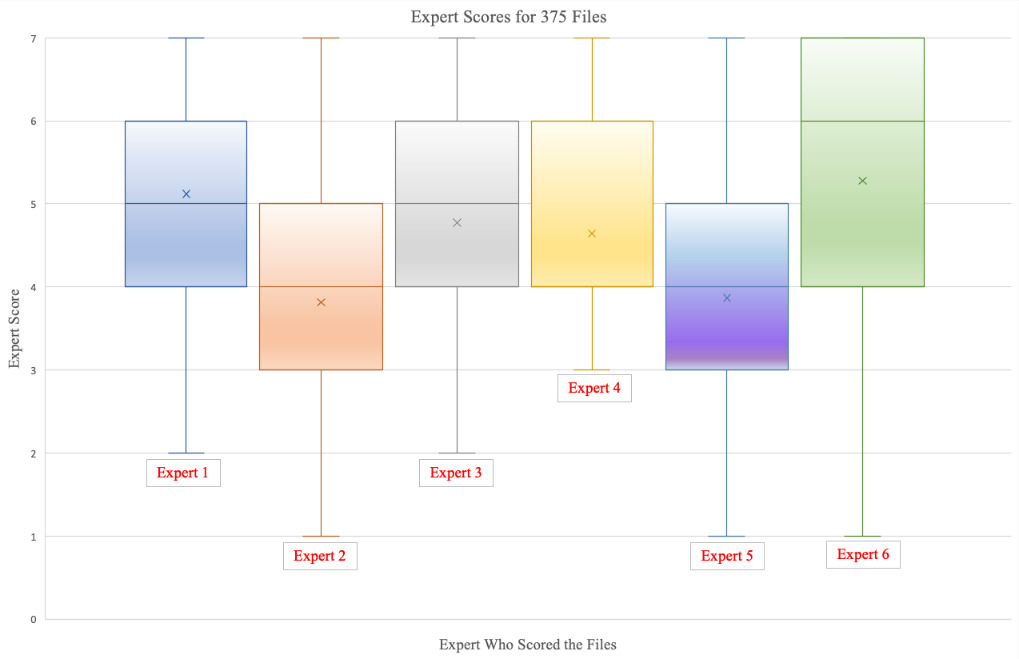
Expert Scoring Results – Discussion. Each expert scored each of the 375 files in my corpus.[95] The average score across all 2250 observations was 4.6, requiring an education level of between “some post-secondary education” and “an undergraduate degree or higher level of non-legal education” from readers to understand the text. Individually, the experts assigned average scores between 3.8 (for the expert with the lowest average text score) and 5.3 (for the expert with the highest average score).[96] The expert scores are represented visually below, in Chart 1, in the form of boxplots. For each expert who scored the set of 375 files, the “box” represents the interquartile range[97] for that expert’s scores. The middle horizontal line represents that expert’s median, or middle, score (the score that has an equal number of higher and lower scores within the sample).[98] The “x” represents the expert’s average score. The “whiskers” extending above and below each box extend to show the full range of scores assigned by the expert.
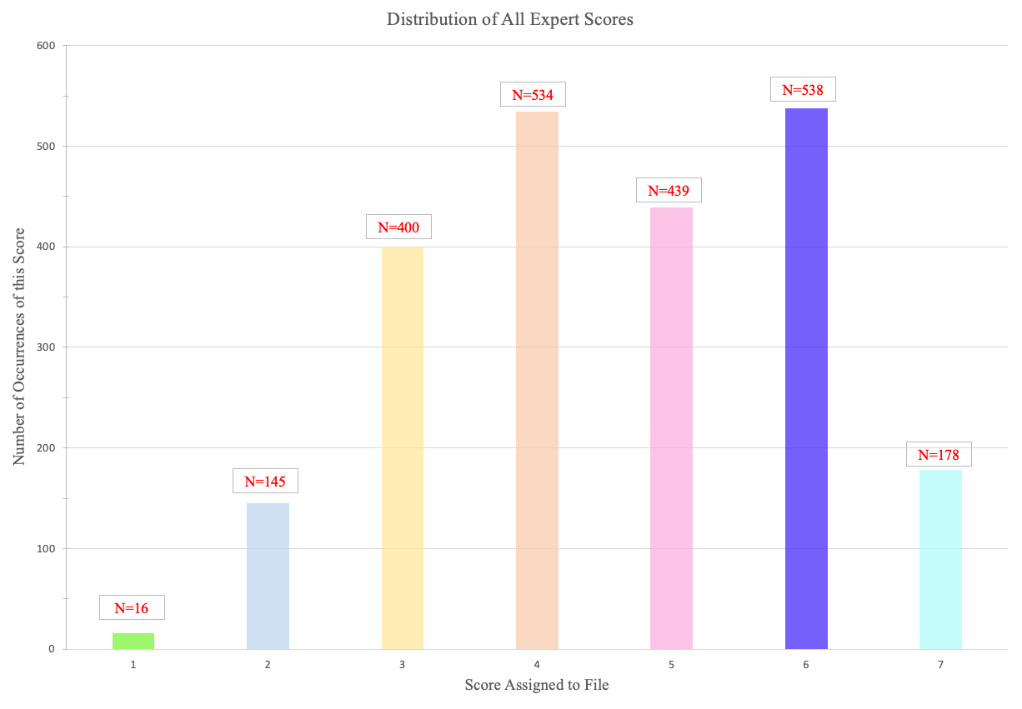
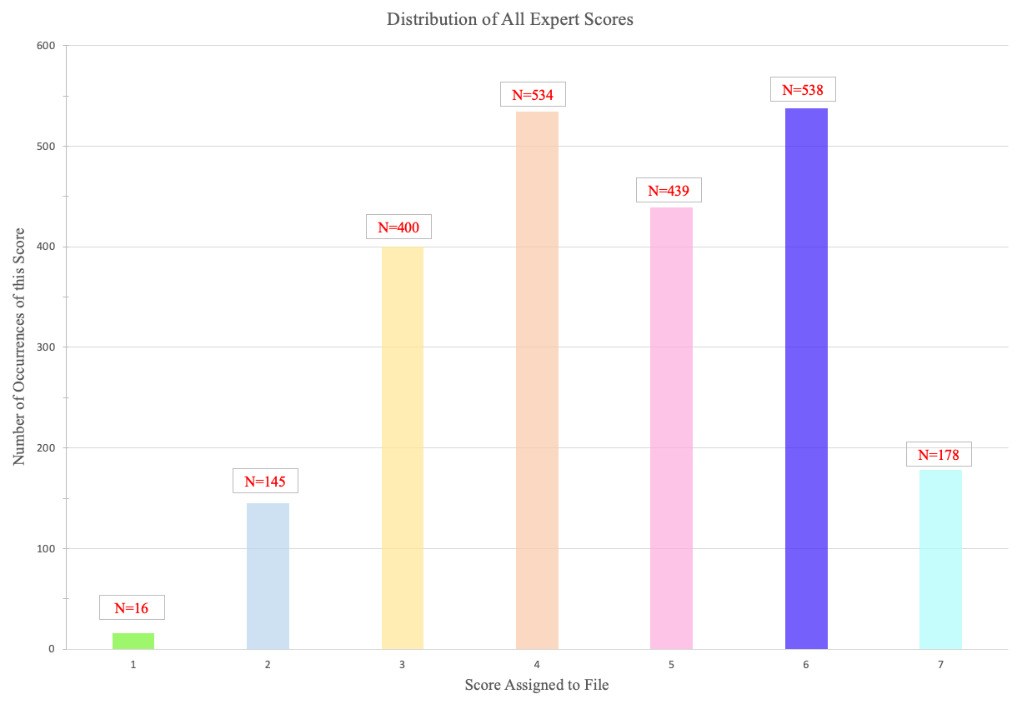
The full distribution of occurrences of each score assigned by the experts is shown below in Chart 2.
To assess the measure of agreement between my six expert raters, I calculated Kendall’s Coefficient of Concordance (“Kendall’s W”). “This statistic assesses the overall degree of agreement in a set of rankings given by several individuals.”[99] Specifically, Kendall’s W was calculated using the individual scores from each expert for each file to determine if there was agreement between the six experts’ judgement on the readability of the 375 text files that they scored.
The six experts statistically significantly agreed in their assessments, W = 0.67, p < 0.001. Landis and Koch suggest that a value of between 0.61 and 0.8 for a statistic like a W-value signifies “substantial” strength of agreement between raters.[100] Others have suggested that “strong consensus” exists for W-values of 0.7 and above, while “moderate consensus” exists for W-values in the range of 0.5 to 0.69.[101] However, in the context of social science and behavioural research, specifically, Kraska-Miller has said that “Kendall’s W can be interpreted as a correlation with weak, moderate, and strong agreement denoted as 0.10, 0.30, and 0.50, respectively.”[102] Based on these characterizations of consensus strength from different contexts, and the calculated W-value, I determined that there is substantial agreement between the expert raters such that their scores are sufficiently reliable for the purposes of this study.
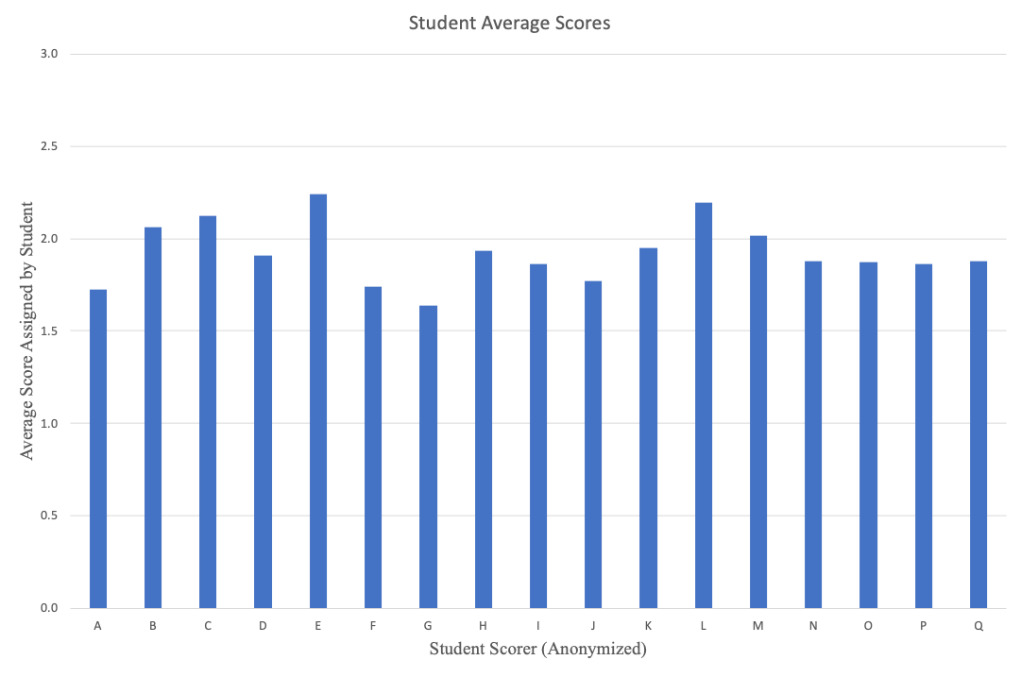
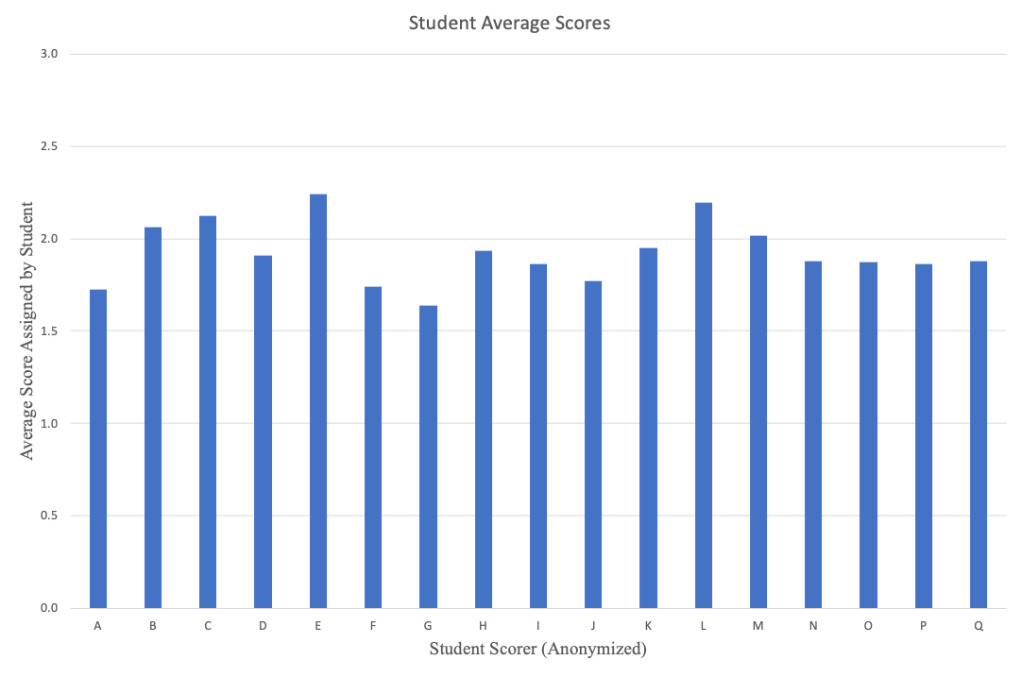
Lay Scoring Results – Discussion and Validation of Expert Scoring. Each of the 375 files in my corpus was read and scored by three Grade 12 student volunteers.[103] The average score across all 1125 student observations was 1.9 (suggesting that the text could be understood by someone with about a Grade 12 education or slightly more). Individually, the students assigned average scores of between 1.6 (for the student with the lowest average text scores) and 2.2 (for the two students with the highest average text scores).[104] The average score assigned by each student is shown below, in Chart 3.
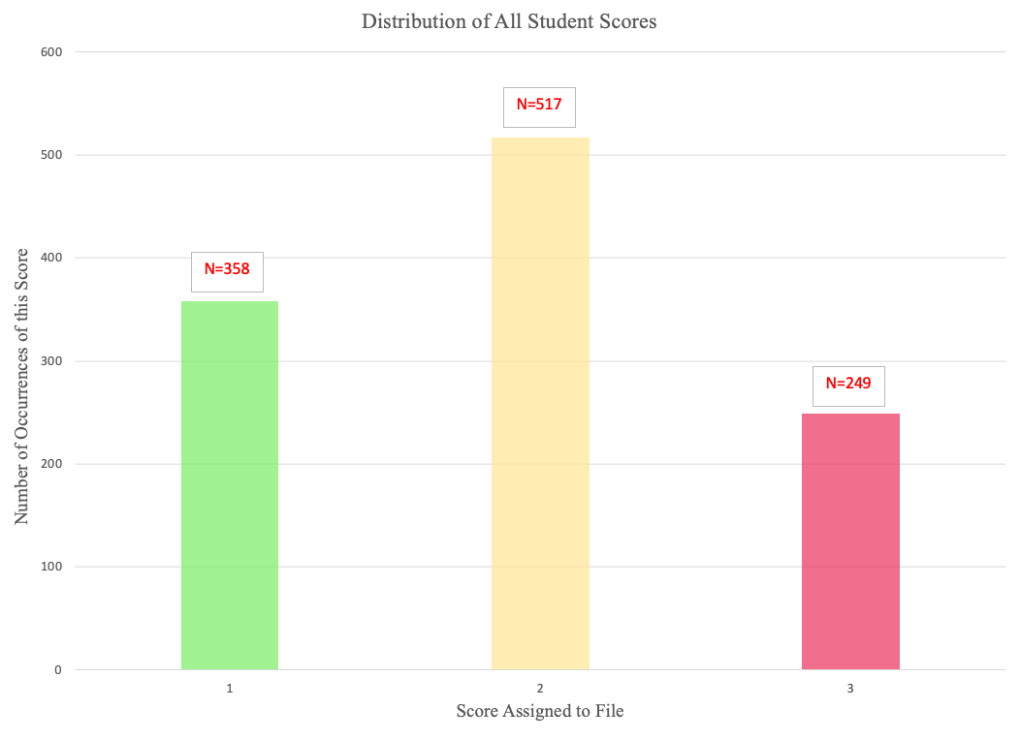
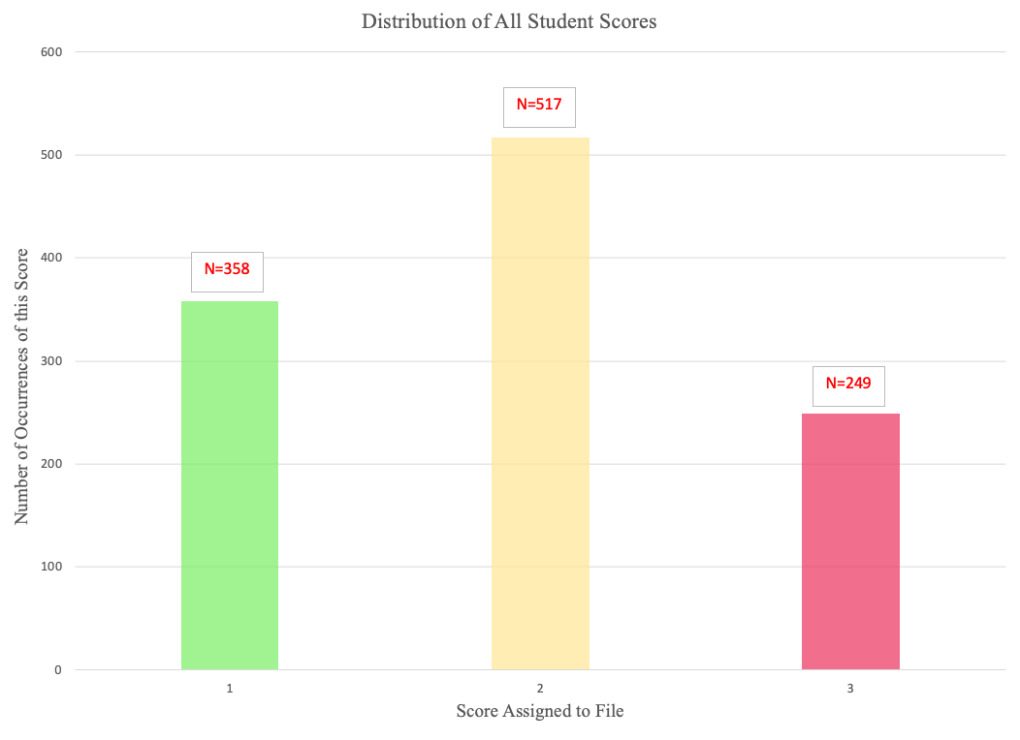
The full distribution of occurrences of each score assigned by the students is shown below in Chart 4.
To compare the relationship between expert and lay raters’ scores, I calculated the Spearman rank-order correlation (“Spearman’s rho”). This statistic measures the direction and strength of any association between two variables (in this case, expert and lay raters’ scores), but it does so based on the relative ranks of the different scores contained within the dataset, rather than on the raw scores.[105] In this sense, the rank-order correlation is scale-independent, so it allows for the identification of significant relationships between different datasets that are not necessarily using the same scale (for instance, where, as in this case, one set of scorers uses a seven-point Likert scale, and the other uses a three-point Likert scale). Because Spearman’s rho uses rank-order scores instead of raw numerical scores, the measurement “trades a slight loss of efficiency relative to the ordinary sample correlation coefficient . . . in exchange for applicability to a much broader array of problems for which rank correlation alone is valid, since it does not require specific distributional assumptions.”[106] In other words, the statistic tends to report slightly reduced correlation strengths, but it is a valid measure of correlation between variables across a wider spectrum of situations than other types of correlation measures.
Specifically, I calculated the average expert rater score (based on the six expert scores) and the average lay rater score (based on three student scores) for each file within the 375-file corpus. I then calculated the Spearman rho for these two variables. There was a statistically significant, positive correlation between lay and expert raters’ average scores, Spearman’s rho = 0.59, p < 0.001. Cohen suggests that a correlation strength of 0.5 or more represents a strong effect size in this type of research context.[107] For the purposes of this study, the strong correlation provides an additional measure of the validity and reliability of the expert raters’ scores.
The key output from this step of my research method was the production of a valid and reliable average expert score for each file within my 375-file corpus. For each file, the average expert score represents an assessment from the collective of expert raters as to where the text falls on the scoring scale that is contained (above) in Figure 1, which is to say, the score tells us what education level the experts believe a reader would need to easily understand the text. As I explain below, this dependent variable was critically necessary for me to develop and test a new law-specific readability formula in Step 2 of my research method.
B. Step 2 – Deriving a New Law-Specific Readability Formula
To derive a new law-specific readability formula, I followed a broad method that in many ways mimics the methods used by almost all other scholars who have developed past readability formulas: I use correlations and regression analysis to identify which linguistic variables, with which weight, are best capable of predicting the “gold standard” scores that my experts assigned to a text.[108]
1. Method – Identifying and Calculating Scores for Relevant Linguistic Variables
To begin, I split my 375-file corpus into two subsets. The first subset, consisting of 250 of the corpus files that were chosen randomly, was earmarked for formula development. The second subset, consisting of the remaining 125 files from the corpus, was earmarked for formula validation and testing. As Ronald D. Snee has suggested, it is important to create or preserve independent data for testing the performance of any predictive regression model, but it can be cumbersome to collect entirely new data for this purpose; consequently, Snee endorses the type of “data-splitting” that I have conducted in this phase of my research as a “reasonable way” to proceed that achieves the desired effect without re-starting the data collection process.[109] Crossley, Skalicky and Dascalu used a similar data-splitting technique when validating their CAREC readability formula.[110]
Next, I identified and measured 1,115 linguistic properties of each file within my 250-file subset, relating to the following categories: lexical/semantic difficulty; syntactic difficulty; sentiment and cognition features; and cohesion features. Each variable category is believed to be capable of influencing the readability of a text.
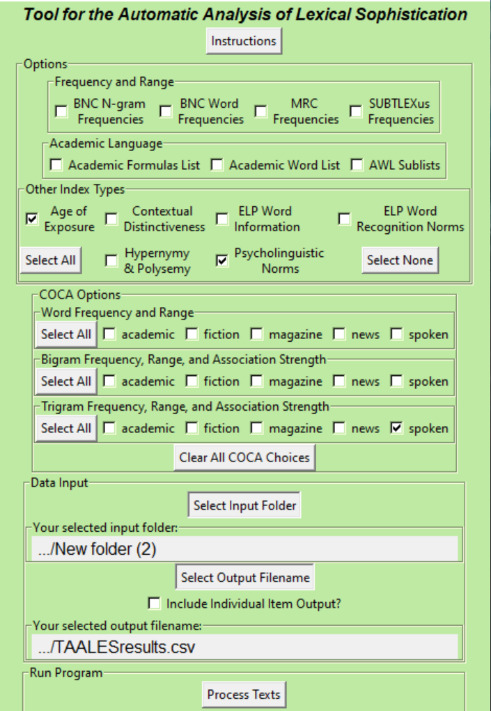
Variables relating to lexical or semantic sophistication measure linguistic features at the word or phrase level: “Reflecting the importance of vocabulary in readability, lexico-semantic features capture attributes associated with the difficulty or unfamiliarity of vocabulary, i.e., specific words or phrases in a text.”[111] Files were processed through the Tool for the Automatic Analysis of Lexical Sophistication (“TAALES”)[112] software. This software measures “over 400 classic and new indices of lexical sophistication and includes indices related to a wide range of sub-constructs.”[113] TAALES calculated scores for each of my files in relation to 221 discrete variables related to lexical or semantic sophistication.[114] The output was saved in a spreadsheet that included 55,250 measurements (i.e., 221 variables for each of 250 files).[115]
Syntax and sentence-level variables have also been found to correlate with reading difficulty levels of texts in previous studies.[116] “Syntax refers to the systematic ways in which discrete units (e.g., words) can be combined to create meaningful utterances (e.g., sentences).”[117] Kristopher Kyle observes that as language learners develop, they “produce longer and more varied syntactic structures,”[118] which suggests that greater experience and competence with a language is needed to understand more complex and sophisticated phrase and sentence structures. I chose to measure a number of different syntactical complexity and sophistication variables. I processed each file through the Tool for the Automatic Analysis of Syntactic Sophistication and Complexity (“TAASSC”) software application,[119] which produced scores for each of my files in relation to 370 discrete variables related to syntactic complexity or sophistication.[120] The output was saved in a spreadsheet that includes 92,500 measurements (i.e., 370 variables for each of 250 files).[121]
Although classic readability formulas tended to only incorporate measurements of syntactic and lexical complexity, more recent thinking about readability suggests that other text properties, such as the overall genre or sentiment of a text may also affect a reader’s motivation to understand the text, and therefore the reader’s overall comprehension of the text.[122] At least one recent readability study found that the use of positive adjectives was strongly and positively correlated with readability results, and relied upon this sentiment-related variable within the reading comprehension formula that the study produced.[123] Because sentiment-related language may have an impact on readability, I opted to measure a large range of sentiment- and cognition-related variables. I processed each file through the Sentiment Analysis and Cognition Engine (“SEANCE”) software,[124] which compares language in a particular text against “254 core indices and 20 component indices based on recent advances in sentiment analysis.”[125] SEANCE calculated scores for each of my files in relation to 441 discrete variables related to sentiment or cognition.[126] The output was saved in a spreadsheet that includes 110,250 measurements (i.e., 441 variables for each of 250 files).[127]
Likewise, text cohesion is key: “Text is more than a series of random sentences: language exhibits higher-level, longer-range structure by virtue of the dependencies and relationships that exist between its elements.”[128] And, “Like syntactic complexity and vocabulary difficulty, cohesion is a theoretical construct believed to be involved in determining reading ease or difficulty.”[129] By making a text more cohesive through the overlapping or reinforcement of words, phrases, and ideas throughout a text, an author would likely also be making the text more readable to at least some people (even if many older readability formulas do not rely upon measures of cohesion).[130] It is perhaps for this reason that cohesion is now commonly studied in relation to text comprehension and readability,[131] and for this reason that measures of a text’s cohesiveness have factored into more recent readability formulas.[132] I thus elected to measure a variety of cohesion-related variables by processing each file through the Tool for the Automatic Analysis of Text Cohesion (“TAACO”)[133] software. This program calculates “150 indices of both local and global cohesion, including a number of type-token ratio indices (including specific parts of speech, lemmas, bigrams, trigrams and more), adjacent overlap indices (at both the sentence and paragraph level), and connectives indices.”[134] TAACO calculated scores for each of my files in relation to eighty-three discrete variables related to cohesion.[135] The output was saved in a spreadsheet that includes 20,750 measurements (i.e., eighty-three variables for each of 250 files).[136]
2. Method – Using Statistical Analysis to Create a Regression Readability Formula
After collecting data on these different linguistic variables, I then determined which of the 1,115 variables demonstrated the strongest relationships with the readability scores that my experts assigned to each text file in my formula-building subset of files. There were ultimately six variables that, in combination, were strongly, independently, and significantly associated with the average expert scores for the texts. These variables were broadly related to lexical sophistication, sentiment and cognition, and syntactical sophistication properties of the texts.
To identify these variables, I first calculated Pearson correlation coefficients to assess the relationship between each of the 1,115 variables and the variable of average expert score—that is, the average “gold standard” score that my experts assigned to a file. I then eliminated any variables where there was no statistically significant correlation (that is, where p > 0.05), and variables where the correlation strength was less than r = 0.325 (either positive or negative), to reduce the list to only the variables that had shown the strongest statistically significant relationship with average expert score. Finally, I eliminated any variables showing multicollinearity (i.e., situations where two or more variables were correlated with one another at a strength of greater than r = 0.6, positive or negative) and kept only the variable that was most strongly correlated with average expert score in such cases. This process of identifying the variables that were most strongly, and independently (i.e., free from multicollinearity), correlated with average expert score reduced the list of variables from 1,115 down to 20 variables.
A hierarchical multiple regression analysis was then run within SPSS software, using the selected linguistic properties as the independent variables to analyze which linguistic features predicted average expert score for the 250 files in the data subset. This approach allowed me to statistically process the effects of each new variable independently, which ultimately showed me the variation in the variable average expert score with each subsequent linguistic variable that was added to the model.[137] Non-significant variables (p > 0.05) were removed from the equation and the regression was re-run without these variables to obtain the final prediction equations. This analysis yielded a significant model, F(6, 243) = 59.243, p < 0.001, r = 0.771, R2 = 0.594.[138] Ultimately, six variables were significant predictors of average expert score, including variables related to lexical sophistication (concreteness, imageability, age of acquisition, and trigram proportion scores), syntactic complexity (dependents per nominal – no pronouns – standard deviation) and sentiment (legal nouns).[139] The R2 value from the model above suggests that this model should be capable of explaining 59.4% of the variance in average expert score, which is well above the threshold for what Cohen would classify as a “large effect size.”[140] Table 1 shows the results from the regression.
The B-weights and the constant from this regression model are the key statistical elements that translate the regression data into a new law-specific readability formula. For predictive purposes, this type of regression analysis creates a formula where the value of the dependent variable X (representing, in this case, the predicted average expert score) can be calculated by the following equation:
X = B0 + (B1V1) + (B2V2) + […] + (B6V6)
where B0 is the regression constant; B1, B2, etc, are the regression B-values for each variable; and V1, V2, etc., are the document-specific values for the respective linguistic variables (as calculated for any text by the different linguistic software applications that I have described above).[141]
Thus, the new law-specific readability formula that I have created, called Madden’s Adjudicative Decision Readability Score (MADRS) is represented by the following equation:
MADRS = 10.036
+ (0.471 * AoA_CW)
- (0.023 * MRC_Imag_AW)
+ (4.513 * GI_Leg_Nouns)
- (0.650 * COCA_Spoken_TriTop30K)
+ (1.802 * Nominal_Deps_NN_StDev)
- (0.018 * MRC_Concr_FW)
If the values of the relevant six variables are known for any adjudicative decision text, then the above equation yields a statistical prediction of the score that my human experts would have assigned to that text. In other words, with this formula, a computer can quickly and effectively calculate the readability score of an adjudicative decision without the need for an expert or other human to sit down and read the document in its entirety. It makes readability assessments, at scale, into a much more practical possibility. I have included step-by-step instructions for calculating MADRS values in an Appendix to this Article. The MADRS formula is now also included within an easy-to-use online readability calculator found at www.readabilitytools.com—thanks to the efforts of linguistics faculty and researchers from Vanderbilt University.[142] Further explanations for each of these variables, and how they are theoretically justified for inclusion in my readability formula, are included below in Part IV.
3. Results – Validating and Testing the New Formula Against Existing Formulas
Having created MADRS from the 250-file subset of the “gold standard” corpus, and having previously split my data to keep the remaining 125 files from this corpus in reserve for the purposes of formula validation and testing, it was possible to compare the performance of MADRS with several other major and general-purpose readability formulas, to determine which formula would be most effective for use in predicting the readability of adjudicative decision texts.
I therefore calculated MADRS scores for each of the 125 files in my remaining subset. I also calculated readability scores using six other readability formulas: Flesch-Kincaid Grade Level / FKGL; Automated Readability Index / ARI; Simple Measure of Gobbledygook / SMOG; New Dale-Chall Readability Formula / DaleChall; Crowdsourced Algorithm of Reading Comprehension-Modified / CAREC-M; and Coh-Metrix L2 Readability Index / CML2RI. These latter readability formula values were all calculated using the Automatic Readability Tool for English[143] software application, which quickly calculates the relevant readability scores using an intuitive interface.[144]
I then calculated Pearson coefficients of correlation to assess the relationships between MADRS and the other six general-purpose readability formulas (on the one hand) and the “gold standard” average expert score that my experts had assigned to each file in the subset (on the other hand). The correlation results are shown below in Table 2.
These results do two things. First, they affirm and validate the MADRS formula’s predictive power on an independent set of adjudicative decision text files (i.e., MADRS scores are strongly correlated with actual average expert scores even for files that were not used in generating the MADRS readability formula). Second, the absolute values of the above correlations demonstrate that MADRS scores have a substantially stronger relationship with average expert score than do any of the other existing general-purpose readability scores. Where r = 0.756 for MADRS, and where this correlation coefficient is -0.504 for the next strongest readability formula (CML2RI), and is only 0.327 for FKGL (perhaps the most widely-used readability formula in existence, and the formula that two Canadian tribunals refer to when discussing the readability of their written materials),[145] the correlation results suggest that MADRS is the most suitable readability tool for measuring the quantitative readability of Canadian court and tribunal decisions.
IV. Discussion: MADRS – A New Law-Specific Readability Formula
Beyond the above statistical analyses that support the validity of MADRS, the formula is also sound from a theoretical perspective. In this Part, I discuss each of the variables that contribute to the MADRS formula, as well as additional considerations that might help readers to understand both the strengths and limitations of the formula.
A. MADRS Includes Variables That Are Consistent with Readability Theory
As I explain in more detail below, the variables that contribute to the formula—and the direction in which those variables pull readability scores—accord with our theoretical understanding of how different linguistic properties render a text more or less readable.
1. Kuperman Age of Acquisition (Content Words) / AoA_CW
This variable measures the age at which individuals would have understood a particular word if someone used it in front of them, even if the individual did not use, read, or write the word themselves at that age.[146] Content words are considered to be an open or expanding class of more semantically rich words that “comprise nouns, verbs, adjectives, and some adverbs.”[147] The MADRS formula relies upon age of acquisition scores for content words (AoA_CW). The value of this variable is calculated using the sum of all age of acquisition scores (for all content words in the text that have such scores) divided by the total number of content words in the text with age of acquisition scores.
The regression B-weight for the variable AoA_CW is 0.471. The positive value of this B-weight indicates the direction of the relationship between the variable and the MADRS value: higher age of acquisition scores will positively affect (or increase) MADRS values, indicating that a text is harder to read. This relationship makes intuitive sense: a text that is filled with content words that are not learned by readers until older ages will logically be harder to read for most people than a text that is filled with content words that are learned by readers at a younger age.
2. Medical Research Council – Imageability (All Words) / MRC_Image_CW
This variable measures the imageability of words used in a text. Imageability refers to the tendency for a word to evoke both a lexical and a visual representation of the word within the mind of a reader/listener: “some words (e.g., moon) may activate a very specific and vivid perceptual representation (e.g., a visual image of a full moon in the night’s sky). . . . Other words (e.g., serene) are considered to be abstract and not closely tied to such perceptual and/or action representations, thus not activating such rich perceptual or action representations.”[148]
The MRC_Imag_AW variable draws on imageability scores for 9,240 different words[149] found in Coltheart’s Medical Research Council Psycholinguistic database.[150] The imageability scores for words in the database range between 129 (“plenipotentiary”) and 667 (“beach”), with an average score of 450 and a standard deviation of 108.[151]
TAALES calculates MRC imageability values for all words (MRC_Imag_AW). The value of this variable is calculated using the sum of all imageability scores (for all words in the text that have such scores) divided by the total number of words in the text with imageability scores.
The regression B-weight for the variable MRC_Imag_AW is -0.023, meaning that higher imageability scores will negatively affect (or decrease) MADRS. This relationship is theoretically sensible. Research has shown that “imageability ratings strongly predict the memorability of items” in a way that is consistent with well-known dual coding theory,[152] according to which “one represents words verbally and as mental images.”[153] Because the human mind has access to two different codes (one semantic and one visual) in the case of more imageable or concrete words, these words are generally easier to process, and should make text more readable. Multiple studies suggest that this hypothesis is borne out in practice,[154] and confirm the theory-based place that the variable MRC_Imag_AW holds in the MADRS formula.
3. General Inquirer Database – Legal (Nouns) / GI_Leg_Nouns
This variable measures the presence of words that are found on a defined list of 192 words associated with legal, judicial, or police matters.[155] The “legal” word list originates from the Harvard IV-4 dictionary lists used by the General Inquirer, a 1966 database consisting of 11,000 words assigned to 119 different word lists.[156] The General Inquirer’s legal word list (GI_Leg_Nouns) includes the following nouns: advocate, auditor, deposition, fugitive, junta, and legislator.[157]
SEANCE calculates values for the variable GI_Leg_Nouns by dividing the number of times a noun in a text is contained within the General Inquirer “legal” word list by the total number of words in the text, thereby calculating the percentage of total words in the text that are listed on the “legal” word list.
The regression B-weight for the variable GI_Leg_Nouns is 4.513. This means that when a text has a higher percentage of words that are legal in nature (i.e., that appear on the “legal” word list), MADRS values will be positively affected. This relationship accords with previous research suggesting that legal language generally, and legal English in particular, is often unintelligible to most non-lawyers.[158] It is therefore not surprising to find that a greater density of legal terms within a text tends to render the text more difficult to understand.
4. COCA – Spoken (Proportion of Trigrams in the Top 30K) / COCA_Spoken_TriTop30K
This variable measures how often trigrams (three-word phrases) within a text can be found within a list of the top 30,000 (i.e., most-frequently used) trigrams contained inside of the Corpus of Contemporary American English – Spoken (COCA – Spoken) sub-corpus. The COCA – Spoken sub-corpus contains over 127 million words from texts that consist of “[t]ranscripts of unscripted conversation from more than 150 different TV and radio programs.”[159]
TAALES computes scores for this variable by identifying every trigram within a text, and then determining the number of trigrams within the text that also appear on a list of the 30,000 most common trigrams within the COCA – Spoken sub-corpus. This number is then divided by the total number of trigrams in the text to give a proportion score that signals the percentage of trigrams in the text that are on the top 30,000 list.
The regression B-weight for the variable COCA_Spoken_TriTop30K is -0.650, meaning that higher trigram proportion scores will negatively affect (or decrease) MADRS values. This relationship is theoretically defensible for two reasons. First, as a general matter, more common and familiar multi-word phrases appear to be easier to understand than less common ones.[160] Second, the frequency with which one encounters words or phrases in spoken English is likely a better marker of one’s ability to understand a word or phrase than the frequency with which one encounters words or phrases in written English.[161] It stands to reason, therefore, that the variable COCA_Spoken_TriTop30K would be inversely related to MADRS values, since a text that contains trigrams that are frequently found in spoken English would theoretically be easier to understand than a text that contains trigrams that are rarely used in spoken English.
5. Dependents / Nominal (No Pronouns, Standard Deviation) / Nominal_Deps_NN_StDev
This variable is a measure of the variation in syntactic complexity of language within a text. The variable first considers nominals (noun-phrases) within a text. The variable then considers how many dependent clauses are associated with each nominal. However,
Noun phrases in English can consist of pronouns; except in very rare cases, pronouns do not take direct dependents (relative clauses being an exception). Due to the potential for pronouns as phrases to skew counts of dependents, TAASSC includes two versions of each index, one that includes pronoun noun phrases in its counts, and one that does not.[162]
The variable Nominal_Deps_NN_StDev does not include consideration of pronoun-based nominals within its measurement. To compute the relevant value for this variable, TAASSC determines the standard deviation for the values of dependents per nominal (excluding pronoun-based nominals) in the text.
The regression B-weight for the variable Nominal_Deps_NN_StDev is 1.802, meaning that higher standard deviations in measurements of dependents per nominal will positively affect (or increase) MADRS values. This relationship is theoretically unsurprising. Higher scores on the variable Nominal_Deps_NN_StDev signify that there is a relatively higher variance of values for the number of dependents per nominal within a text (both above and below the average value). Since the range of possible values for the number of dependents per nominal is bounded by 0 at the low end, and is unbounded at the high end, a higher score for the variable Nominal_Deps_NN_StDev would likely be reflective of a text that has relatively more sentences with multiple dependents per nominal.
Research has shown that individuals have a harder time understanding what a sentence means when it has a complex structure (which would include sentences with relatively more dependent or subordinate clauses), in part because more working memory is needed to decode such a sentence.[163] And research in the legal domain, specifically, has shown a very strong negative correlation between the use of embedded or dependent clauses and text comprehension: with more embedded clauses, we see a drop in comprehension.[164]
6. Medical Research Council – Concreteness (Function Words) / MRC_Concr_FW
This variable measures the concreteness of words used in a text. Concreteness is similar to, but conceptually distinct from, imageability (discussed above). Concreteness refers to the extent to which a word represents something that can be experienced by the senses. Thus, “[a]ny word that refers to objects, materials, or persons should receive a high concreteness” score.[165] Concreteness is contrasted with abstractness, where highly concrete and highly abstract words fall at opposite ends of the rating spectrum.[166]
The MRC_Concr_FW variable from the MADRS formula draws on concreteness scores for 8,228 different words[167] found in Coltheart’s Medical Research Council Psycholinguistic database.[168] Concreteness scores for words in the database range between 158 (“as”) and 670 (“milk”), with an average score of 438 and a standard deviation of 120.[169]
The MADRS formula relies upon concreteness scores for function words (MRC_Concr_FW).[170] Function words are considered to be a closed class of words consisting of “pronouns, articles, conjunctions, quantifiers, and prepositions” that fill grammatical functions, but that do not tend to carry significant lexical meaning.[171] The value of this variable is calculated using the sum of all concreteness scores (for all function words in the text that have such scores) divided by the total number of function words in the text with concreteness scores.
The regression B-weight for the variable MRC_Concr_FW is -0.018, meaning that higher concreteness scores will negatively affect (or decrease) MADRS values. This relationship is supportable in theory. “Words that are rated as highly concrete have been found to be processed more quickly in lexical decision.”[172] The same variable has also independently been found (in another study that developed the Crowdsourced Algorithm of Reading Speed) to have a negative relationship with reading speed: texts that use more concrete words tended to be read more quickly than texts that use fewer concrete words.[173]
B. MADRS Is Length-Independent
The preceding discussion explained how each variable that contributes to the MADRS formula has a justifiable theoretical—and even sensible—rationale for inclusion within the formula. From a processing perspective, however, there are other reasons why the formula should be theoretically expected to perform well.
To begin, all the contributing variables are proportion or ratio variables that measure distinct linguistic properties in ways that should not be affected by the length of a text (at least above a certain extreme minimum). This consideration makes the MADRS formula more robust when applied to texts of different lengths than formulas like the Crowdsourced Algorithm for Reading Comprehension (“CAREC”), which incorporated the variable “Lemma type count (content words)” into its readability calculations.[174] Unlike every other variable that contributes to the CAREC formula, this variable is a raw score variable that we would expect to manifest in increasingly higher numbers depending on the length of the text that is being studied (for most narrative or expository texts that are non-repetitive) because longer non-repetitive texts will tend to use a greater variety of words than shorter texts. The MADRS formula is not susceptible to these text length-based skews because of its exclusive reliance on proportion or ratio component variables, instead of on raw score variables that tend to increase with text length.
C. MADRS Is Minimally Vulnerable to NLP Parsing and Tagging Errors
The MADRS formula is also resilient, for the most part, against skews that might arise due to inaccurate tokenization, tagging, or parsing[175] of adjudicative decision text files by Natural Language Processing (“NLP”) software tools. Adjudicative decisions are written in a peculiar style. For instance, they often include inline citations to cases or secondary sources that can use multiple periods (e.g., to signal where a court name or journal name has been abbreviated, or after the “v” that represents the word “versus” between two party names within a case name). These periods will generally be read as full stops—denoting the end of a sentence—by NLP tokenization tools, since the tools are generally not sophisticated enough to always distinguish between instances where a period is used to represent a full stop, and where it is used to signal an abbreviation.[176]
As a result, a readability formula that relies on sentence length (or other sentence syntax variables), which itself depends on accurate assessments by NLP tools as to where sentences begin and end, will tend to be somewhat inaccurate when used on adjudicative decision texts. The ultimate extent of these inaccuracies will depend on the weighting of the sentence-level variable within the overall formula and the number or density of inaccuracies within the text.
To be clear, the MADRS formula does include one sentence-syntax variable that is vulnerable to the type of skewing that I have noted above (Dependents per nominal (no pronouns, standard deviation)). But the remaining five variables that contribute to the MADRS formula are not dependent on sentence-level segmentation of a text by NLP tools because they relate to words or trigrams that are likely to be processed by NLP tools as accurately for adjudicative decisions as for any other texts.
Thus, while the MADRS formula is not wholly immune to inaccuracies based on poor NLP tokenization, tagging, or parsing of a text, the formula is certainly less vulnerable to these skews when compared to, for instance, the two Flesch readability formulas that both rely on sentence length as one of the two variables within the formulas. MADRS would similarly be less vulnerable than the Coh-Metrix L2 Reading Index formula, that includes “[p]roportion of noun and pronoun lemma types that occur in the next two sentences for all sentences” as one of only three variables in the formula.[177] In both of these examples, the other formulas are much more heavily dependent on accurate NLP segmentation of the text into sentences than the MADRS formula, based on the ratio of sentence to non-sentence variables in the respective formulas.
D. MADRS Justifiably Excludes Certain Variables from the Formula
As explained above, the MADRS formula includes different variables relating to lexical (word) difficulty, trigram frequency, sentiment and cognition, and syntax. But the formula does not include any variables relating to cohesion, and it is not necessarily obvious from a theoretical perspective why certain variables were included within the formula instead of others that might also make sense. I will explain the thought processes behind some of these decisions.
1. Cohesion Variables Do Not Feature Within MADRS
There are good reasons to believe that cohesion has an impact on readability. I described these reasons above when I explained why I chose to measure cohesion-related properties of the 250 files that were used to create the MADRS formula. It is therefore somewhat surprising that MADRS does not ultimately incorporate any cohesion measures within the formula.
One explanation for the absence of cohesion variables within MADRS is grounded in statistics. On initial review of the correlations between all 1,115 linguistic variables for which I computed scores and the average score assigned by human experts, I found that two cohesion-related variables had statistically significant correlation strengths above the r = 0.325 cutoff that I had applied: (1) pronoun density (r = -0.385); and (2) pronoun-noun ratio (r = -0.402). However, these two cohesion variables showed strong multicollinearity (r = 0.973), which suggests that they were likely both measuring the same or closely related properties within the text. I therefore only included the second variable within my hierarchical regression modeling calculations, since the second variable was more strongly correlated with my average expert score.
During the hierarchical regression modeling calculations, however, this cohesion variable was not found to add to the model in a statistically significant way. The variable was therefore eliminated from the ultimate model that now describes the MADRS formula—as were fourteen other variables that were eliminated for the same reason. In other words, the statistical modeling process caused the cohesion variable to be excluded from the MADRS formula not because the variable is unrelated to readability, but because other variables contribute to the model in more powerful and statistically significant ways. I make this point because I continue to believe that cohesion variables likely do play an important role in determining how well a person will understand a text—even if there are no such variables within the MADRS formula for reasons that relate to the statistical development of the formula.
Other research into cohesion has shown that cohesion sometimes helps—and sometimes hinders—a reader’s understanding of a text.[178] The difference appears to depend in part on the reader’s prior knowledge: “Low-knowledge readers gain greatly from added cohesion whereas more knowledgeable readers (but not necessarily experts) can gain from lower cohesion. This phenomenon has been referred to as the reverse cohesion effect.”[179] While the reverse cohesion effect may seem counter-intuitive, it can be theoretically explained in the following way: “[T]he high-knowledge readers . . . were able to gain from low-cohesion text because it forced them to generate inferences, and that inferencing resulted in a better, or deeper, understanding of the text.”[180] So, while it is possible that MADRS fails to accurately account for cohesion as a readability variable in adjudicative decisions, it is also possible that cohesion does not have a predictable or uniform effect on reading comprehension. The exclusion of cohesion variables is thus prudent and theoretically sound.
In any case, no readability scholar would suggest that cohesion is the only or determinative variable that affects readability. It is now widely accepted that readability is a function of many different types of language variables. Consequently, one can apply the MADRS formula with a high degree of confidence—but with a healthy awareness of the fact that the formula does not present a complete picture of all the different factors that might influence reading comprehension—because of the formula’s wide base in different language variables that are linked to reading comprehension.
2. Other Excluded Variables
We might intuitively question why certain other variables were included or excluded from the final MADRS formula. For instance, it is relatively easy to see why a variable that measures the concreteness of words would feature within a readability formula based on my explanation of the theory behind concrete language, above. But if the variable is influential, why does the MADRS formula only measure its impact in relation to function words (Medical Research Council – Concreteness (Function Words) / MRC_Concr_FW), as opposed to content words, or all words?
Again, there is a valid explanation for inclusion of variables like this one that is grounded in statistics (that, for the sake of brevity, will not be fully restated here).[181] But looking at the concreteness scores for actual function words might help to better illustrate—in non-statistical terms—why the Medical Research Council – Concreteness (Function Words) / MRC_Concr_FW variable was included in MADRS. Consider the following table of the 10 highest- and lowest-scoring function words in the MRC’s concreteness database:[182]
Note how the most concrete function words tend to be personal pronouns, while the least concrete function words tend to be prepositions and conjunctions.
This observation, together with my earlier explanation about how two different cohesion variables related to pronoun density and ratios within a text both correlated strongly with average expert score, offer an independent explanation for why the variable MRC_Concr_FW is included within MADRS. Perhaps the presence of personal pronouns within a text at high densities really does have a positive effect on readability (and a negative effect on MADRS values). The high density of these pronouns may add cohesion to a text that makes it easier to understand (by signifying very clearly who is performing actions within a text in ways that readers can easily follow). And perhaps the variable MRC_Concr_FW (in light of what we can see in the above table) is just a better predictor of the effect that a high density of personal pronouns will have on a reader’s understanding of a text than other related measures of how pronouns are used within a text.
As I hope the above discussion has shown, sound statistical justifications (related to correlation strengths, multicollinearity, and significance of contributions to hierarchical regression models) support the inclusion and exclusion of variables from the MADRS formula. And post facto theoretical hypotheses and/or justifications explain the same inclusions and exclusions of different variables. While this leaves us in a position where we cannot explain with certainty why MADRS is highly reliable and legitimate in predicting the average readability score that human experts would assign to a text, it does leave us with a new law-specific readability formula that performs exceedingly well when compared against comparator formulas—which is itself an important achievement for anyone who wants to develop a clear picture of the readability levels of Canadian adjudicative decisions.
V. MADRS Applied: The Readability of SCC Opinions from 2022
For illustrative purposes, I will describe the results of a small study that was conducted using the MADRS formula to measure the readability of Supreme Court of Canada (SCC) opinions issued in 2022. As a general matter, this study reveals that all SCC judges are producing opinions that most Canadian audience members would be unlikely to easily understand, although the extent to which this is true varies from one judge to the next. Some of the differences may be explained by considerations about how each judge sees their respective audiences.
A. Method – Applying MADRS to SCC Opinions from 2022
I generated a database of text files that comprised the entire population of SCC opinions from 2022, where each text file contains a single judicial opinion. This means that there were multiple files for some decisions, if the decisions included dissenting or concurring opinions. Any opinion with fewer than 400 words was excluded. The MADRS formula was developed using texts of approximately 600 words, so opinions with fewer than 400 words would not necessarily provide enough linguistic information for the MADRS formula to accurately score the text.
I then calculated MADRS results for each opinion, following the instructions that are included at the end of this Article in the Appendix.
B. Results – Measuring the Readability of SCC Opinions from 2022
This study measures the readability of all opinions meeting the inclusion criteria (N=75) from the Supreme Court of Canada in 2022, broken down by author. The complete results, including the citation for the case, the authoring judge of the opinion, the MADRS value for the opinion, and the MADRS component variable scores for each variable, are included within a publicly available spreadsheet.[183]
The MADRS results in the publicly available spreadsheet, and those discussed below, must be understood by referring to the original scoring criteria that human experts originally applied to assess the readability of adjudicative decision texts. Scores are linked to the education levels that readers would need to easily understand a text. A score of 7 indicates that a law degree and some familiarity with the subject of the text is needed; 6 means a law degree is required; 5 means that at least a completed undergraduate degree is needed; 4 means some post-secondary education is needed; 3 means a high school diploma is needed; 2 means some high school education is needed; and 1 means that someone with no high school education could easily understand the text. The full table describing the MADRS scoring scale is reproduced from Figure 1 for ease of reference:
Of the seventy-five SCC opinions included in the present study, thirteen were collectively written, and sixty-two were individually written. Chart 5 shows each judge’s scores in alphabetical order from left to right, in the form of boxplots. The scores are overwhelmingly clustered in the range of between 5 and 6 on the MADRS scale, indicating that something more than a completed undergraduate degree would be needed to easily understand almost all the decisions in this study.
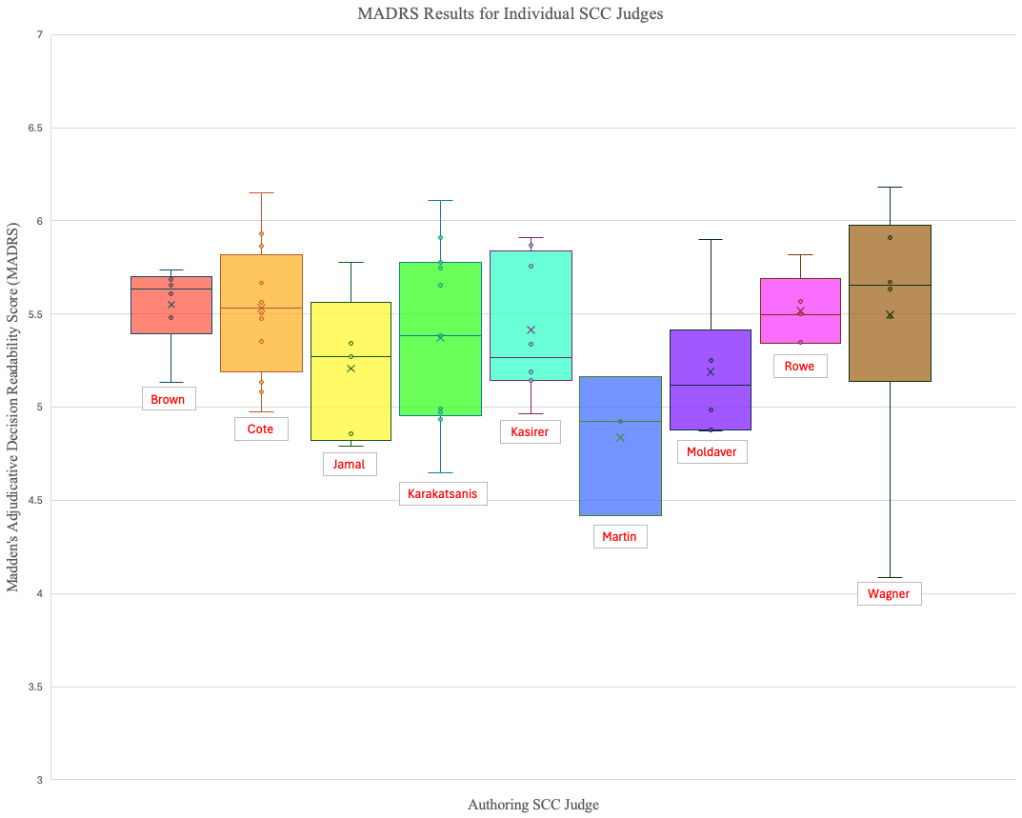
In the above boxplots, the “x” marks represent each judge’s average readability score. Table 4, below, displays the average MADRS opinion score for opinions written by each individual judge of the court, with the total number of opinions by that judge included in parentheses. The results in this table are sorted from least to most readable average opinion score.
C. Discussion – Analyzing the Readability of SCC Opinions from 2022
If one compares the above average readability scores for certain judges with their answers provided on questionnaires submitted as part of the application process for appointment to the SCC, then the relative rankings are not necessarily surprising. Specifically, Justices Rowe, Martin, Kasirer, and Jamal were all appointed after the Canadian government began publishing questionnaire responses from successful applicants for judicial appointments. Each of these SCC judges therefore has shown us their answers to the question, “Who is the audience for Supreme Court of Canada decisions?”
Justice Rowe’s response is in many ways the least indicative of a desire to speak directly to the Canadian public through his decisions. He states:
Criminal law will remain one of the most closely watched areas of the Court’s jurisprudence, given the large number of criminal cases that are always underway and the relatively frequent restatements of law that occur. Beyond the Bar & Bench, there are, of course, the accused, those affected by crime and various advocacy groups. As well, journalists have found that the public has an appetite for reporting on criminal matters.[184]
He also says that, in constitutional equality rights cases, “given the importance of such decisions for how Canadian society sees itself, the audience can readily be the broad public.”[185] He does not mention self-represented litigants in his response, and beyond the two relatively narrow examples cited above, he construes his audience as being quite small. It is perhaps understandable (although not necessarily desirable) that Justice Rowe has the highest average MADRS result from within the group of SCC judges whose answers to the audience question are publicly available. Justice Rowe does not see the public as an audience for many SCC decisions, so he may not expend as much effort as others do to linguistically reach people with lower levels of reading competency with his decisions.
Justices Kasirer and Jamal both include the broad public and people with less education as parts of their audiences for decisions. Justice Kasirer suggests that SCC decisions teach the population about the law, and “this function speaks to a specific audience: legal professionals and judges in all jurisdictions, law professors and researchers in related fields, students from high school to the doctorate level, etc.”[186] He also implies that members of the public need to be able to understand SCC decisions as a matter of legitimacy: “a proper explanation of a rule not only allows the outcome of the case to be properly grasped, but also gives the public and the media an understanding of the legitimacy of the exercise of public power that every judgment of the Court represents.”[187] Justice Jamal similarly affirms that the “public has a right to understand how their highest court is grappling with the most pressing legal issues of the day.”[188] He also believes that the decisions should convey meaning to all readers, regardless of whether they are lawyers.[189]
Both Justices Kasirer and Jamal also mention self-represented litigants within their answers about who the audience is for SCC decisions.[190] Where these two judges have turned their minds to the potentially broad need for ordinary members of the population to understand their decisions, it is logical that their average MADRS results would be lower than Justice Rowe’s average.
Justice Martin’s response is even stronger. She dedicates five complete paragraphs to her explanation of how the public is an audience for SCC decisions, after spending the first five paragraphs explaining (more briefly) how litigants, lawyers and judges, Canadian governments, academics, and international stakeholders are all audiences as well.[191] Justice Martin’s emphasis on communicating to the public is very prominent in her response. This consideration of her audience, which likely informs Justice Martin’s approach to her opinion-writing, may help to explain why she has the most readable average MADRS decision result of the SCC judges within this study and why she is the only judge whose average decision requires less than a completed undergraduate degree to understand.
In reality, however, the results shown above in Table 4 demonstrate that none of the SCC judges are writing in ways that most of the Canadian population can easily understand. Statistics Canada data from the 2021 census indicates that only 32.9% of the Canadian population between the ages of 25 and 64 have a “Bachelor’s degree or higher.”[192] However, 8 of the 9 SCC judges within the present study have average MADRS decision scores of greater than 5.0, indicating that a completed undergraduate degree would be needed to understand their average decisions.
What is striking about this information is the manifest discrepancy between what the SCC judges say they are trying to do within their decisions (that is, reach their audiences—audiences that often include the Canadian public) on the one hand, and their failure to mobilize language within their decisions in ways that will accomplish their stated goals, on the other hand. The SCC judges’ efforts to communicate with their audiences are no doubt sincere, but the results in this study suggest that more work is needed to make these efforts successful.
Conclusion – MADRS: Law’s Own Comprehensive Readability Formula
Within this Article, I have developed and used the most appropriate tool for assessing the readability level of Canadian adjudicative decisions: Madden’s Adjudicative Decision Readability Score, or MADRS. This new readability formula was created from a reference corpus of law-specific texts that are similar in quality and kind to the types of texts that the formula is primarily intended to score: adjudicative decisions. The formula is designed to predict the “gold standard” scores that human experts assigned to texts, where these expert scores had been independently validated through their strong correlation with scores that normal people (twelfth grade students) who are not lawyers assigned to the same texts. From a performance perspective, the MADRS formula is far superior to any existing general-purpose readability formula when used on adjudicative decision texts, as shown by its much stronger correlation to the “gold standard” expert scores within my formula validation and testing subset of 125 files.
I have also illustrated, through a short study of the readability of SCC opinions from 2022, how the MADRS formula can be usefully applied to adjudicative decisions to generate new insights or lines of inquiry for those who are interested in these decisions. The SCC case study within this Article is merely one among many possible studies that can contribute to our understanding of the readability of decisions by Canadian judges and tribunal members. One can hope that other researchers will find it useful to apply the MADRS formula in other diverse, relevant, and important contexts.
Furthermore, considering the similar styles and forms of language that are often used within court and tribunal decisions from other countries, including the United States, whose legal systems grew out of roots in England’s common law,[193] the MADRS formula has widespread potential for uses across these countries. The formula can help us understand where readability levels are in a variety of different contexts. Do decision-makers write more readable decisions in cases involving self-represented litigants? Do tribunals write more readable decisions on particular subjects than reviewing courts do on the same subjects? Are there individual judges or tribunal members who write particularly readable decisions, and who might serve as models for other adjudicators who aspire to write readable decisions? Answers to these and a host of other similar questions are now reliably possible, using the MADRS formula. And much of my in-progress research is focused on answering these questions—with preliminary results that are, at alternating times, surprising, encouraging, and discouraging. There is certainly ample space for more big-data examinations of the readability of adjudicative decisions in English-speaking common law countries.
For those who are interested in using the MADRS formula—for scholarly, institutional (within a court or tribunal), or other purposes—I have included “Instructions for Computing MADRS Values” at the end of this Article in the Appendix. For most users, however, it will likely be simpler to calculate MADRS results for text files using the online readability calculator found at www.readabilitytools.com.
Ideally, the MADRS formula will propel our knowledge forward from both assessment / diagnostic perspectives (understanding the readability level of decisions), and intervention / solution perspectives (identifying strategies that we might adopt to enhance readability levels based on what we know about any past successes in producing readable decisions). From long-term and aspirational perspectives, we can also hope that the formula will help reduce barriers to understanding case law that people might currently face, so that those governed by the law have a greater likelihood of understanding court and tribunal decisions that affect their lives.
Appendix
Instructions for Calculating MADRS Values
The easiest way to calculate a MADRS value for a text is using the online readability calculator available at www.readabilitytools.com. Scores can be calculated there for either a single text, or a set of texts.
Alternately, scores can be calculated in the following manner.
-
First, each decision/opinion (from the first word to the last word of the decision, but excluding all other front- and end-matter) should be saved as a discrete plain text (.txt) file within a directory to be processed.
-
Linguistic variable scores are calculated for each of the six MADRS variables.
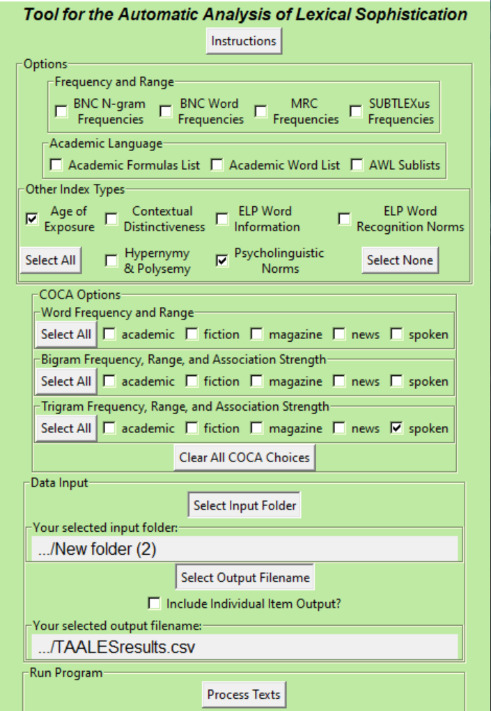
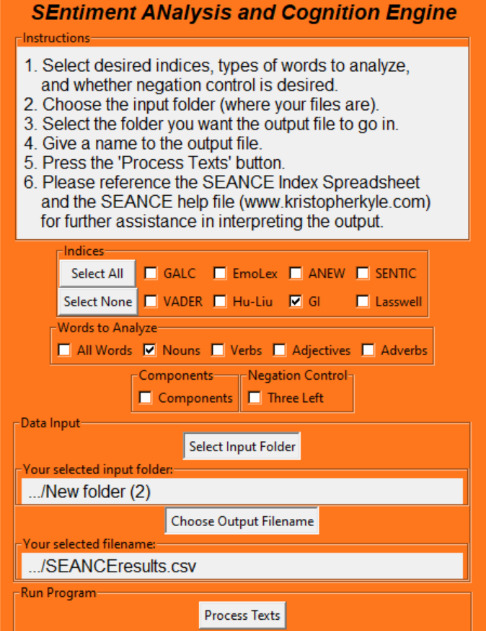
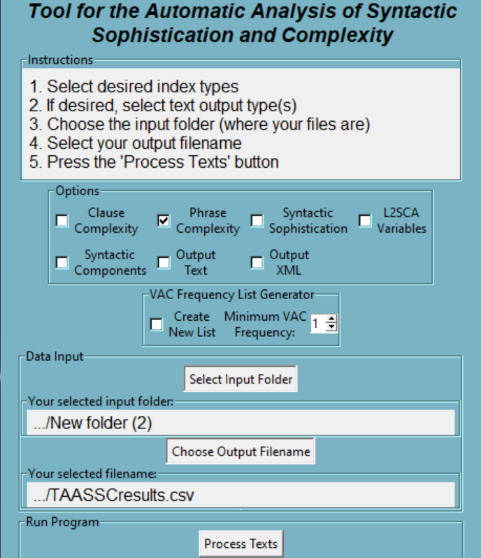
-
Scores for each of the six variables, for each text file, are copied and pasted into a new Excel spreadsheet.
-
The variable scores for each file are combined together in accordance with the regression equation that creates the MADRS formula to produce a MADRS value for each decision. The regression equation is reproduced below:
MADRS = 10.036
+ (0.471 * AoA_CW)
- (0.023 * MRC_Imag_AW)
+ (4.513 * GI_Leg_Nouns)
- (0.650 * COCA_Spoken_TriTop30K)
+ (1.802 * Nominal_Deps_NN_StDev)
- (0.018 * MRC_Concr_FW)
- The MADRS results are scored on a scale of 1-7, explained below:
See, e.g., Canadian Charter of Rights and Freedoms, Part I of the Constitution Act, 1982, being Schedule B to the Canada Act, 1982, c.11, preamble (U.K.).
Joseph Raz, The Authority of Law 214 (1979).
See, e.g., Lon L. Fuller, The Morality of Law 39 (rev. ed. 1969) (explaining that “failure to make rules understandable” could prevent creation or maintenance of a system of legal rules); John Finnis, Natural Law and Natural Rights 270–71 (2d ed. 2011) (identifying clarity and coherence as attributes of a legal system that is “legally in good shape”).
Ryan Whalen, Judicial Gobbledygook: The Readability of Supreme Court Writing, 125 Yale L.J.F. 200, 200 (2015).
Id.
See, e.g., Stephen M. Johnson, The Changing Discourse of the Supreme Court, 12 U.N.H. L. Rev. 29, 66 (2014) (measuring both the length and readability levels of United States Supreme Court opinions during the periods between 1931-33 and 2009-11, and finding that the more recent decisions were longer and less readable); Jennifer Bowie & Elisha Carol Savchak, State Court Influence on US Supreme Court Opinions,10 J.L. & Courts 139, 157, 159 (2022) (considering whether the United States Supreme Court tended to copy language directly from lower court decisions if the lower court decisions were more readable, and finding that the Court was more likely to have copied passages from within decisions that avoided the passive voice, but that readability scores were not significantly associated with copying).
See, e.g., Brian M. DeFriez, Toward a Clearer Democracy: The Readability of Idaho Supreme Court Opinions as a Measure of the Court’s Democratic Legitimacy 75, 83 (Aug. 2017) (Ph.D. Dissertation, University of Idaho’s College of Graduate Studies) (on file with author) (undertaking qualitative and quantitative studies of Idaho court decisions and noting that the decisions scored higher on multiple readability measurements over time).
See, e.g., Brenda Danet, Language in the Legal Process, 14 Law & Soc. Rev. 445, 464–69 (1980) (describing historical and contemporary critiques of legal language); see also Robert P. Charrow & Veda R. Charrow, Making Legal Language Understandable: A Psycholinguistic Study of Jury Instructions, 79 Colum. L. Rev. 1306, 1359 (1979) (empirically evaluating language of jury instructions and concluding that “jury instructions are not written for their major intended [lay] audience”).
See Julie Macfarlane, The National Self-Represented Litigants Project: Identifying and Meeting the Needs of Self-Represented Litigants – Final Report 15 (May 2013), https://representingyourselfcanada.com/wp-content/uploads/2016/09/srlreportfinal.pdf [https://perma.cc/QH4E-AR3H] (reporting that in 2024, 80% of all cases in California family court included at least one self-represented litigant).
Lilian Ma, Athanasios Hadjis, Gary Yee, Marilyn McNamara & Taivi Lobu, Council of Canadian Administrative Tribunals, A National Survey of Tribunal Responsiveness to Self-Represented Parties: Measuring Access to Justice for Canadian Administrative Tribunals 6–7 (Aug. 11, 2015), https://www.ccat-ctac.org/wp-content/uploads/2021/11/AJCpaper-FinalPOSTAugust112015.pdf [https://perma.cc/U8ZM-MR4A] (identifying the average percentage of self-represented parties in Canadian jurisdictions).
Joseph Goldstein, The Intelligible Constitution: The Supreme Court’s Obligation to Maintain the Constitution as Something We the People Can Understand 19 (1992) (“[J]ustices, as members of a collective body, have an obligation to maintain the Constitution, in opinions of the Court and also in concurring and dissenting opinions, as something intelligible—something that We the People of the United States can understand. . . . [T]hey have a professional obligation to articulate in comprehensible and accessible language the constitutional principles on which their judgements rest”).
Barry Sullivan & Ramon Feldbrin, The Supreme Court and the People: Communicating Decisions to the Public, 24 U. Pa. J. Const. L. 1, 28 (2022).
Id.
For instance, one might reasonably expect that court decisions, factums, memorandums of argument, and opinion letters, drafted by lawyers or judges from English-speaking common law jurisdictions, would contain similar kinds of language to the language found in Canadian court decisions. These documents are therefore good candidates for readability assessments using this Article’s new formula, subject to certain considerations discussed below. See infra notes 55–58 and accompanying text.
See, e.g., Sullivan & Feldbrin, supra note 12, at 14–18 (noting “the traditional view that courts should speak only through their formal, written opinions” and that, despite exceptions to and historical variances from that practice, “the tradition of written opinions is now well entrenched in American legal culture, and the practice of publishing these opinions has long been considered central to our justice system”); see id. at 19 (“[W]ritten opinions are generally understood to speak for themselves.”).
E.g., Baker v. Canada (Minister of Citizenship and Immigration), [1999] 2 S.C.R. 817 para. 39 (Can.) (“The process of writing reasons for decisions by itself may be a guarantee of a better decision.”).
Soc. Sec. Tribunal of Can., Evolution of Plain Language Decision Writing § 5.3 (Feb. 28, 2023), https://www.sst-tss.gc.ca/en/our-work-our-people/evaluation-plain-language-decision-writing [https://perma.cc/K76A-2ZFZ].
See Alan Bailin & Ann Grafstein, Readability: Text and Context 34–44 (2016) (describing different readability measures that are benchmarked to a reader’s grade level).
See, e.g., Off. of the Comm’r for Fed. Jud. Affs. Can., The Honourable Mahmud Jamal’s Questionnaire, Part 10, Question 4 (June 17, 2021), https://fja-cmf.gc.ca/scc-csc/2021/nominee-candidat-eng.html [https://perma.cc/UT76-TXQK] [hereinafter Jamal Questionnaire] (“[T]he Court’s decisions speak directly to the Canadian public. The public has a right to understand how their highest court is grappling with the most pressing legal issues of the day.”); Can. Dep’t of Just., The Honourable Justice Michele Hollins’s Questionnaire (March 31, 2017), https://www.canada.ca/en/department-justice/news/2017/03/the_honourable_justicemichelehhollinssquestionnaire.html [https://perma.cc/U2B3-NDWN] (“As we continue to see increasing numbers of unrepresented litigants, the public is also an audience for judicial decisions and a compelling reason to make written decisions clear and concise.”); Off. of the Comm’r for Fed. Jud. Affs. Can., The Honourable Nicholas Kasirer’s Questionnaire, Part 10, Question 4 (July 10, 2019), https://www.fja.gc.ca/scc-csc/2019/nominee-candidat-eng.html [https://perma.cc/2QR9-7VDN] [hereinafter Kasirer Questionnaire] (“I support any measure intended to increase the parties’ understanding of the reasons, and I note recent initiatives taken by the Supreme Court to limit the risks that its decisions will be misunderstood, especially given the increase in the number of self-represented litigants.”).
See Off. of the Comm’r for Fed. Jud. Affs. Can., The Honourable Michelle O’Bonsawin’s Questionnaire (Aug. 19, 2022), https://fja-cmf.gc.ca/scc-csc/2022/nominee-candidat-eng.html [https://perma.cc/2AK8-4ZHH] (“Another audience [for Supreme Court of Canada decisions] includes lower courts, the legal profession, legislatures, academics, media[,] and the public.”).
See Can. Dep’t of Just., The Honourable Jill Miriam Copeland’s Questionnaire (May 30, 2022), https://www.canada.ca/en/department-justice/news/2022/05/the-honourable-jill-miriam-copelands-questionnaire.html [https://perma.cc/YU5T-CP89] (“The public is also an important audience for Court of Appeal decisions. . . . This is not a process of pandering to the public or trying to write a decision that the public will like. . . . But a judge has a duty to explain what decision he or she has made and why.”).
See Off. of the Comm’r for Fed. Jud. Affs. Can., The Honourable Renu Mandhane’s Questionnaire (Mar. 28, 2022), https://www.canada.ca/en/department-justice/news/2022/03/the-honourable-renu-mandhanes-questionnaire.html [https://perma.cc/78YS-QK8R] (“Reasons must provide guidance to the public, including the media. This requires reasons that are written in plain language, efficient, and available in accessible formats.”).
Ombudsman Sask., Practice Essentials for Administrative Tribunals 69 (2020), https://ombudsman.sk.ca/app/uploads/2020/03/Practice-Essentials-Final-with-Cover.pdf [https://perma.cc/QE9S-RPAA].
Soc. Sec. Tribunal of Can., An Evaluation of How Easy it is to Read Decisions of the Social Security Tribunal (last modified Jan. 10, 2024),
https://sst-tss.gc.ca/en/our-work-our-people/evaluation-easy-it-read-decisions-social-security-tribunal [https://perma.cc/RN6L-V5SC].
Id. (emphasis added).
Id.; J. Peter Kincaid, Robert P. Fishburne Jr., Richard L. Rogers & Brad S. Chissom, Inst. For Simulation & Training, Research Branch Report 8–75: Derivation of New Readability Formulas (Automated Readability Index, Fog Count and Flesch Reading Ease Formula) for Navy Enlisted Personnel 4–5 (1975). The Flesch-Kincaid Grade Level readability formula was originally developed to help assess the readability of training manuals for military personnel. Kincaid et al., supra, at 1.
Soc. Sec. Tribunal of Can., supra note 24.
Interview by Resolve Disputes Online with Shannon Salter (Nov. 2019), https://resolvedisputes.online/blog_shannon_salter.html [https://perma.cc/K443-SV43].
Shannon Salter & Darin Thompson, Public-Centred Civil Justice Redesign: A Case Study of the British Columbia Civil Resolution Tribunal, 3 McGill J. Disp. Resol. 113, 124 (2017) (citing Richard S. Safeer & Jann Keenan, Health Literacy: The Gap Between Physicians and Patients, 72 Am. Fam. Physician 463, 468 (2005)).
Id.
See, e.g., Sullivan & Feldbrin, supra note 12, at 51.
See Rudolph Flesch, A New Readability Yardstick 32 J. Applied Psych. 221, 221 (1948) (noting a formula’s use in evaluating, among other works, “materials for adult education” and “children’s books”).
See Kincaid et al., supra note 26, at 1 (noting a formula’s use for evaluating materials for Navy personnel).
Consider, for instance, a trial court decision that depends entirely on its facts, addresses a relatively niche area of law, implicates no significant public interest factors, and involves sophisticated parties represented by counsel. In cases like this, the parties (and their lawyers) may be the only audience members for the decision, so it arguably does not need to be written any more readably than these individuals require for their own comprehension.
Here is a description of how Goodhart’s law can interfere with quality assessment:
Quality systems need to capture inchoate qualitative concepts into quantitative data which can be collected and analysed. Thus they use proxies to measure underlying variables. For example, the measure of how long one is kept waiting in a casualty department is captured by the proxy of the proportion of people who are seen by a member of medical staff within five minutes. Before quality systems are introduced, the proxies may be excellent approximations of underlying quality. However, Goodhart’s law suggests that the more one targets the proxy, by insisting that performance indicators are met, the weaker becomes the relationship between the proxy and the underlying variable. Thus hospitals may be employing ‘hello’ nurses to greet people on arrival in accident and emergency departments. The performance target is met, but only at the cost of withdrawing resources from staff involved in treatment: the queue to see the doctor may become longer.
Tamara Goriely, The English Legal Aid White Paper and the LAG Conference, 3 Int’l J. Legal Pro. 353, 358–59 (1996).
See Jon Khan, “The Life of a Reserve”: How Might We Improve the Structure, Content, Accessibility, Length & Timeliness of Judicial Decisions? 57–63 (2019) (LL.M. Thesis, University of Toronto), https://tspace.library.utoronto.ca/bitstream/1807/98120/1/Khan_Jon_ _201911_LLM_thesis.pdf [https://perma.cc/JC9F-USXN] (discussing judges’ reluctance to engage with questions about how they perform their work, perhaps because of their perceptions of what judicial independence requires of them, and noting that survey “data indicates that courts have expansive views about judicial independence: they believe that judicial independence precludes them from imposing structural or stylistic requirements upon judges”).
This understanding of the term “readability” is consistent with the way in which the term is used throughout William H. Dubay, The Principles of Readability (2004), https://files.eric.ed.gov/fulltext/ED490073.pdf [https://perma.cc/T4WT-JY6H]. It also accords with definitions of the terms that have been used by other scholars whose work Dubay reviews. See id. at 3.
See Bailin & Grafstein, supra note 18, at 15–45 (describing many existing readability formulas, the quantitative variables upon which each formula depends, and the numerical scoring scale that each formula uses to express the formula’s output).
Flesch, supra note 32, at 228–29.
Id. at 222–23.
Id. at 222.
Edgar Dale & Jeanne S. Chall, A Formula for Predicting Readability, 27 Educ. Rsch. Bull. 11, 16–18 (1948).
Id. at 15.
Kincaid et al., supra note 26, at 6–7.
Scott A. Crossley, Stephen Skalicky & Mihai Dascalu, Moving Beyond Classic Readability Formulas: New Methods and New Models, 42 J. Rsch. Reading 541, 548–54 (2019).
Id. at 552–53.
DeFriez, supra note 7, at 30; Johnson, supra note 6, at 56–57.
See, e.g., George R. Milne, Mary J. Culnan & Henry Greene, A Longitudinal Assessment of Online Privacy Notice Readability 25 J. Pub. Pol’y & Mktg. 238, 241 (2006) (evaluating readability of online consumer privacy notices).
See Crossley et al., supra note 45, at 557 (noting “inherent weaknesses of classic readability models”).
See Jiaping Zheng & Hong Yu, Readability Formulas and User Perceptions of Electronic Health Records Difficulty: A Corpus Study, 19 J. Med. Internet Rsch. 1, 11 (2017) (concluding that “the widely used and highly correlated FKGL, SMOG, and GFI readability scales did not show adequate agreement with human ratings, and thus were not appropriate to address the readability of [electronic heath record] notes”).
Id. at 2.
Id. at 8.
James W. Cunningham, Elfrieda H. Hiebert & Heidi Anne Mesmer, Investigating the Validity of Two Widely Used Quantitative Text Tools, 31 Reading & Writing 813, 814 (2018) (“Almost all readability formulas, past and present, are regression equations.”).
Each of the following studies uses this procedure: Crossley et al., supra note 45, at 550–54; Flesch, supra note 32, at 222–24; and Dale & Chall, supra note 42, at 15–18.
See generally Gerald J. Hahn, The Hazards of Extrapolation in Regression Analysis, 9 J. Quality Tech. 159 (1977).
David J. Olive, Linear Regression 37 (2017).
Flesch, supra note 32, at 229.
Hahn, supra note 55, at 159–60.
Sasikiran Kandula & Qing Zeng-Treitler, Creating a Gold Standard for the Readability Measurement of Health Texts, 2008 AMIA Ann. Symp. Proc. 353, 354.
Scott A. Crossley, Renu Balyan, Jennifer Liu, Andrew J. Karter, Danielle McNamara & Dean Schillinger, Predicting the Readability of Physicians’ Secure Messages to Improve Health Communication Using Novel Linguistic Features: Findings from the ECLIPPSE Study, 13 J. Commc’n Healthcare 344, 347 (2020).
Danet, supra note 8, at 476–77.
Id. at 469.
Id. at 477–81.
Gerald Lebovits, Alifya V. Curtin & Lisa Solomon, Ethical Judicial Opinion Writing, 21 Geo. J. Legal Ethics 237, 251 (2008).
A “corpus,” in the context of linguistics, simply refers to a database, collected group, or body, of text documents. See, e.g., Vaclav Brezina, Statistics in Corpus Linguistics: A Practical Guide 6 (2018) (defining corpus as “a collection of written texts or transcripts of spoken language that can be searched by a computer using specialized software”).
There is widespread acknowledgement in readability studies that some form of human-generated reading difficulty assessment is needed as the gold standard from which follow-on predictive models can be derived. See, e.g., Kandula & Zeng-Treitler, supra note 59 (relying on expert ratings performed by humans to generate readability scores); Orphée de Clercq, Veronique Hoste, Bart Desmet, Philip Van Oosten, Martine De Cock & Lieve Macken, Using the Crowd for Readability Prediction, 20 Nat’l Language Eng’g 293, 299–304 (2012) (taking as a given that human-generated assessments are needed to develop a gold standard, but debating the merits of using expert raters as compared to non-expert—crowdsourced—readability raters).
See, e.g., Mabel Vogel & Carleton Washburne, An Objective Method of Determining Grade Placement of Children’s Reading Material, 28 Elementary Sch. J. 373 (1928); Cunningham et al., supra note 53, at 814.
Crossley et al., supra note 45.
Crossley et al., supra note 60.
Kandula & Zeng-Treitler, supra note 59.
See generally Wayne A. Danielson & Dominic L. Lasorsa, A New Readability Formula Based on the Stylistic Age of Novels, 33 J. Reading 194 (1989) (tracking reductions over time in average sentence lengths and percentages of long words within select novels published between 1740 and 1979—and speculating that today’s readers are less skilled at decoding texts with longer sentences and words).
This dataset of 375 text files, including the case name and citation for the decision from which the text was extracted, is publicly available. Mike Madden, MADRS_MaddenDissertation_Chapter3_375FilesScored V2, Harvard Dataverse (June 4, 2024), https://dataverse.harvard.edu/dataset.xhtml?persistentId=doi:10.7910/DVN/J9Y3MH [https://doi.org/10.7910/DVN/J9Y3MH].
Crossley et al., supra note 45, at 547.
Crossley et al., supra note 60, at 346.
Crossley et al., supra note 45, at 547.
Crossley et al., supra note 60, at 347.
Scott A. Crossley, Limitations of Natural Language Processing Tools for Data Mining: Text Length and Grade Level Differences, in Proceedings of the 11th International Conference on Educational Data Mining 630 (Kristy Elizabeth Boyer & Michael Yudelson eds., 2018). It seems from this study that one can acquire a more refined picture of the relationship between linguistic variables and other variables being studied if the sample of language that is used is relatively larger. Id. at 633 (noting that “longer texts lead to stronger associations between linguistic features reported by NLP tools and math success within an online tutoring system”).
These search queries were intended to, among other things: generate broad jurisdictional coverage of texts from all federal and provincial/territorial (except Quebec) courts; include some likely more readable decisions (from tribunals identified in my research as ones with interest in producing readable decisions); include some likely less readable decisions (on subjects like tax law and intellectual property law that would likely be foreign and abstract to many readers); ensure that a minimum number of frequently-cited decisions were included; ensure that a minimum number of administrative tribunal decisions were included; etc.
I endeavored to select passages in equal measure from roughly the first 1/3, the middle 1/3, and the final 1/3 of decisions.
See Crossley et al., supra note 60, at 347 (using text samples of approximately 300 words to generate the authors’ Model of Text Readability in Physicians formula); Kincaid et al., supra note 26, at 6 (using a set of eighteen texts with an average length of 170 words to generate the Flesch-Kincaid Grade Level readability formula).
I saved each file using arbitrary combinations of letters and numbers for the file name. This file naming protocol ensured that when the files were sorted alphabetically in a computer folder, they would be listed in an arbitrary order. A volunteer participant who was reading and scoring files based on their alphabetical order in a file folder would therefore not come across the files in any particularly relevant order and would therefore encounter files from each of my thirteen search query groups more or less at random.
Crossley et al., supra note 60.
Kandula & Zeng-Treitler, supra note 59.
Id. at 357. Although there are drawbacks to using expert raters, the benefits outweigh the costs:
The gold standard we created relies on expert knowledge, rather than direct user testing. Ideally, we would like to test each document on a representative sample of users. However, adult health care consumers are extremely diverse. Given the formidable cost of testing a large number of documents on a large number of patients, we believe the experts’ opinion can serve as a reasonable proxy.
Id.
De Clercq et al., supra note 66, at 299.
Id. at 297.
Id.
Id. at 302.
Scott Crossley, Aaron Heintz, Joon Suh Choi, Jordan Batchelor, Mehrnoush Karimi & Agnes Malatinszky, A Large-Scaled Corpus for Assessing Text Readability, 55 Behav. Rsch. Methods 491, 504 (2023).
Kandula & Zeng-Treitler, supra note 59.
Quinten Steenhuis, Bryce Willey & David Colarusso, Beyond Readability with RateMyPDF: A Combined Rule-based and Machine Learning Approach to Improving Court Forms, in Proceedings of International Conference on Artificial Intelligence and Law (2023), https://dl.acm.org/doi/10.1145/3594536.3595146 [https://doi.org/10.1145/3594536.3595146].
Kandula & Zeng-Treitler, supra note 59.
One of these student volunteers did not complete any scoring (without explanation), so ultimately, only seventeen students scored files (with three of the remaining seventeen students graciously agreeing to share the extra scoring responsibilities of the eighteenth student).
A spreadsheet containing individual and average expert scores for all 375 files is publicly available. Mike Madden, MADRS_MaddenDissertation_Chapter3_375FilesExpertScores V1, Harvard Dataverse (June 4, 2024), https://dataverse.harvard.edu/dataset.xhtml?persistentId=doi:10.7910/DVN/NQ0EYO [https://doi.org/10.7910/DVN/NQ0EYO].
In ascending order, the experts’ individual average assigned scores were as follows: 3.8 / 3.9 / 4.6 / 4.8 / 5.1 / 5.3.
“Interquartile range” refers to the range between the 25th and 75th percentiles; it offers a view of the middle 50% of the data points, and is less sensitive to outlier points than other dispersion measures. Michael O. Finkelstein & Bruce Levin, Statistics for Lawyers 25 (3d ed. 2015).
For Expert 4, the median line is not visible, because the median score assigned by this expert was 4. Since the median score and the lower extremity of the interquartile range are both “4” for this expert, the median line does not appear within the boxplot (or appears directly on top of the line showing the lower boundary of the inter-quartile range).
Ángel García-Crespo, Ricardo Colomo-Palacios, Pedro Soto-Acosta & Marcos Ruano-Mayoral, A Qualitative Study of Hard Decision Making in Managing Global Software Development Teams, 27 Info. Sys. Mgmt. 247, 248 (2010).
J. Richard Landis & Gary G. Koch, The Measurement of Observer Agreement for Categorical Data, 33 Biometrics 159, 165 (1977).
Roy Schmidt, Kalle Lyytinen, Mark Keil & Paul Cule, Identifying Software Project Risks: An International Delphi Study, 17 J. Mgmt. Info. Sys., no. 4, 2001, at 5, 13 (indicating “strong consensus” is “W>0.70” and “moderate” consensus is “W>0.50”).
M. Kraska-Miller, Nonparametric Statistics for Social and Behavioral Sciences 191 (2014); see also Riccardo Russo, Statistics for the Behavioural Sciences: An Introduction 201 (2003) (“As a rule of thumb, if W is less than 0.5 there is no substantial agreement between judges.”).
A spreadsheet containing individual and average student scores for all 375 files is publicly available. Mike Madden, MADRS_MaddenDissertation_Chapter3_375FilesStudentScores V1, Harvard Dataverse (June 4 2024), https://dataverse.harvard.edu/dataset.xhtml?persistentId=doi:10.7910/DVN/GJYYRB [https://doi.org/10.7910/DVN/GJYYRB].
In ascending order, the students’ individual average assigned scores were as follows: 1.6 / 1.7 / 1.7 / 1.8 / 1.9 / 1.9 / 1.9 / 1.9 / 1.9 / 1.9 / 1.9 / 2.0 / 2.0 / 2.1 / 2.1 / 2.2 / 2.2.
Finkelstein & Levin, supra note 97, at 366.
Id.
Jacob Cohen, Statistical Power Analysis for the Behavioral Sciences 80–81 (2d ed. 1988).
Cunningham et al., supra note 53, at 814 (“Almost all readability formulas, past and present, are regression equations.”).
Ronald D. Snee, Validation of Regression Models: Methods and Examples, 19 Technometrics 415, 416–20 (1977).
Crossley et al., supra note 45.
Kevyn Collins-Thompson, Computational Assessment of Text Readability: A Survey of Current and Future Research, 165 Int’l J. Applied Linguistics 97, 106 (2014).
Kristopher Kyle, Scott Crossley & Cynthia Berger, The Tool for the Automatic Analysis of Lexical Sophistication (“TAALES”): Version 2.0, 50 Behav. Rsch. Methods 1030 (2018).
https://www.linguisticanalysistools.org/taales.html [https://perma.cc/T6DN-MD6N] (last visited Oct. 13, 2025).
For illustrative purposes, the variables include: average word frequency and range counts from the Brown, London-Lund, and Lorge corpora; average word familiarity scores from the Medical Research Council’s Psycholinguistic Database; average Brysabaert Concreteness scores for words in the text; and the average frequency score for Bigrams (two-word phrases) in a text, based on occurrences of the bigrams in the Corpus of Contemporary American English – Spoken – database.
A spreadsheet containing all TAALES results for the 221 linguistic variables is publicly available. Mike Madden, MADRS_MaddenDissertation_Chapter3_250FilesTAALESResults V1, Harvard Dataverse (June 4, 2024), https://dataverse.harvard.edu/dataset.xhtml?persistentId=doi:10.7910/DVN/OTDPQI [https://doi.org/10.7910/DVN/OTDPQI].
The Flesch Reading Ease, Dale-Chall, and Flesch-Kincaid Grade Level readability formulas each rely on sentence length as a contributing variable. See Flesch, supra note 32, at 229; Dale & Chall, supra note 42, at 17–18; Kincaid et al., supra note 26, at 14.
Kristopher Kyle, Measuring Syntactic Development in L2 Writing: Fine Grained Indices of Syntactic Complexity and Usage-Based Indices of Syntactic Sophistication 1–2 (2016) (Ph.D. Dissertation, Georgia State University), https://scholarworks.gsu.edu/server/api/core/bitstreams/d1c169a1-981e-4e26-9b66-6a816e0cc85d/content [https://doi.org/10.57709/8501051].
Id. at 2.
Kristopher Kyle & Scott A. Crossley, Measuring Syntactic Complexity in L2 Writing Using Fine-Grained Clausal and Phrasal Indices, 102 Mod. Language J. 333 (2018).
For illustrative purposes, the variables include: average number of prepositions per clause; average number of possessives per noun subject; average number of conjunctions per clause; and average number of verb-phrases per T-unit (essentially, a T-unit is the smallest unit into which text can be divided while still producing a complete and grammatically correct sentence).
A spreadsheet containing all TAASSC results for the 370 linguistic variables is publicly available. Mike Madden, MADRS_MaddenDissertation_Chapter3_250FilesTAASSCResults V1, Harvard Dataverse (June 4, 2024), https://dataverse.harvard.edu/dataset.xhtml?persistentId=doi:10.7910/DVN/G4Q1DE [https://doi.org/10.7910/DVN/G4Q1DE].
Collins-Thompson, supra note 111, at 110.
Crossley et al., supra note 45, at 553 tbl. 2.
Scott A. Crossley, Kristopher Kyle & Danielle S McNamara, Sentiment Analysis and Social Cognition Engine (SEANCE): An Automatic Tool for Sentiment, Social Cognition, and Social Order Analysis, 49 Behav. Rsch. Methods 803 (2017).
https://www.linguisticanalysistools.org/seance.html [https://perma.cc/JK33-6TTE] (last visited Oct. 13, 2025).
For illustrative purposes, the variables include: percentage of words that are positive adjectives; percentage of words that are adverbs associated with fear; and percentage of words that are nouns associated with hostility.
A spreadsheet containing all SEANCE results for the 441 linguistic variables is publicly available: Mike Madden, MADRS_MaddenDissertation_Chapter3_250FilesSEANCEResults V1, Harvard Dataverse (June 4, 2024), https://dataverse.harvard.edu/dataset.xhtml?persistentId=doi:10.7910/DVN/QVPDBS [https://doi.org/10.7910/DVN/QVPDBS].
Collins-Thompson, supra note 111, at 108–09.
Michael Flor & Beata Beigman Klebanov, Associative Lexical Cohesion as a Factor in Text Complexity, 165:2 Int’l J. Applied Linguistics 223, 226 (2014).
Collins-Thompson, supra note 111, at 109 (“Well-organized, cohesive content should be on average more readable than texts that are not, yet properties like cohesion are not captured by traditional readability formulas.”).
See, e.g., Danielle McNamara & Arthur C. Graesser, Coh-Metrix: An Automated Tool for Theoretical and Applied Natural Language Processing, in Applied Natural Language Processing: Identification, Investigation, and Resolution 188, 190 (Philip M. McCarthy & Chutima Boonthum-Denecke eds., 2012).
See, e.g., Danielle S. McNamara, Arthur C. Graesser, Philip M. McCarthy, & Zhiqiang Cai, Automated Evaluation of Text and Discourse with Coh-Metrix 76–77, 84–95 (2014) (describing the authors’ Text Ease and Readability Assessor that measures referential and deep cohesion, among other variables); Crossley et al., supra note 45, at 553 tbl. 2 (showing how the authors relied upon the presence of temporal connecting words—an indicator of temporal cohesion within a text—as a variable that influences their readability formula).
Scott A. Crossley, Kristopher Kyle & Danielle S. McNamara, The Tool for the Automatic Analysis of Text Cohesion (TAACO): Automatic Assessment of Local, Global, and Text Cohesion, 48 Behav. Rsch. Methods 1227 (2016).
https://www.linguisticanalysistools.org/taaco.html [https://perma.cc/KT75-DLPP] (last visited Oct. 13, 2025).
For illustrative purposes, the variables include: average adjacent sentence overlap – all lemmas (the average number of lemma types, i.e., words that share a common root, that occur at least once in the next sentence); average number of synonym overlaps across paragraphs for verbs (showing how words or their synonyms appear in successive paragraphs); percentage of words in the text that are sentence-linking words (like “nonetheless,” “therefore,” and “although”); and percentage of words in the text that are ordering words or temporal connectives (like “to begin,” “next,” and “first”).
A spreadsheet containing all TAACO results for the eighty-three linguistic variables is publicly available: Mike Madden, MADRS_MaddenDissertation_Chapter3_250FilesTAACOResults V1, Harvard Dataverse (June 4, 2024), https://dataverse.harvard.edu/dataset.xhtml?persistentId=doi:10.7910/DVN/BL8TDW [https://doi.org/10.7910/DVN/BL8TDW].
Here is an explanation of the benefits of hierarchical multiple regression:
Hierarchical multiple regression has been popularly used in nursing research to predict a dependent variable based on multiple independent variables. Unlike standard multiple regression where all independent variables are entered at one time, a strength of hierarchical multiple regression is that the researcher can select the order of entering variables based on a logical or theoretical background. This allows the research to examine the variation in the dependent variable with each subsequent addition of an independent variable.
Younhee Jeong & Mi Jung Jung, Application and Interpretation of Hierarchical Multiple Regression, 35 Orthopaedic Nursing 338, 338 (2016).
There was independence of residuals, as assessed by a Durbin-Watson statistic of 1.882. There was homoscedasticity, as assessed by visual inspection of a plot of studentized residuals versus unstandardized predicted values. There were no leverage values greater than 0.1, and no values for Cook’s distance above 0.1. The assumption of normality was met, as assessed by a Q-Q Plot.
A spreadsheet of the linguistic variable scores for each of the six variables, and the average expert score, for each of the 250 files that were used to create the MADRS formula, is publicly available. Mike Madden, MADRS_MaddenDissertation_Chapter3_LinguisticVariableScores250Files V1, Harvard Dataverse (June 3, 2024), https://dataverse.harvard.edu/dataset.xhtml?persistentId=doi:10.7910/DVN/NCQYJ1 [https://doi.org/10.7910/DVN/NCQYJ1].
Cohen, supra note 107, at 80. Cohen suggests that R2 values of more than 0.25 can be considered as representing large effect sizes. Id.
See Snee, supra note 109, at 415 (explaining how regression coefficients and constants produce predictive equations in this manner); see also Richard J. Cook, Ker-Ai Le, Benjamin W.Y. Lo, R. Loch Macdonald, Classical Regression and Predictive Modeling, 161 World Neurosurgery 251, 251–52 (2022) (same as it relates to medical statistical analysis).
I am deeply indebted to Scott A. Crossley and Joon Suh Choi, who agreed to provide the coding and web-hosting support that was needed to include the MADRS formula within their Automated Readability Tool for English (ARTE) web-based readability calculator.
See Joon Suh Choi & Scott A. Crossley, Advances in Readability Research: A New Readability Web App for English, in 2022 International Conference on Advanced Learning Technologies 3 (discussing the Automatic Readability Tool for English).
https://www.linguisticanalysistools.org/arte.html [https://perma.cc/FQ7G-6C6M] (last visited Sep. 5, 2025); https://www.readabilitytools.com [https://perma.cc/JMW4-JSZ3] (last visited Sep. 5, 2025).
See Soc. Sec. Tribunal of Can., supra note 24.
Victor Kuperman, Hans Stadthagen-Gonzalez & Marc Brysbaert, Age-of-Acquisition Ratings for 30,000 English Words, 44 Behav. Rsch. Methods 978, 980 (2012).
Helen Bird, Sue Franklin & David Howard, ‘Little Words’—Not Really: Function and Content Words in Normal and Aphasic Speech, 15 J. Neurolinguistics 209, 210 (2002).
Maya M. Khanna & Michael J. Cortese, How Well Imageability, Concreteness, Perceptual Strength, and Action Strength Predict Recognition Memory, Lexical Decision, and Reading Aloud Performance, 29 Memory 622, 622 (2021).
Michael Wilson, MRC Psycholinguistic Database: Machine-Usable Dictionary, Version 2.00, 20 Behav. Rsch. Methods, Instruments & Computs. 6, 6–7 (1988).
See Max Coltheart, The MRC Psycholinguistic Database, 33A Quarterly J. Experimental Psych. 497 (1981) (describing the database).
MRC Psycholinguistic Database, Univ. W. Austrl., https://websites.psychology.uwa.edu.au/school/MRCDatabase [https://perma.cc/FB2L-HGU4] (last visited Oct. 12, 2025).
Khanna & Cortese, supra note 148, at 628, 632, 634.
Id. at 628.
See generally Mark Sadoski, Erin M. McTigue & Allan Paivio, A Dual Coding Theoretical Model of Decoding in Reading: Subsuming the Laberge and Samuels Model, 33 Reading Psych. 465, 489–92 (2012).
Descriptions of Inquirer Categories and Use of Inquirer Dictionaries, Harvard University General Inquirer, https://inquirer.sites.fas.harvard.edu/homecat.htm [https://perma.cc/FGR7-2V42] (last visited Sep. 2, 2025).
See id.; Crossley et al., supra note 124, at 807.
List of Entries in Legal Tag Category, Harvard University General Inquirer, https://inquirer.sites.fas.harvard.edu/Legal.html (last visited Sep. 2, 2025).
Danet, supra note 8, at 463–69; see also Charrow & Charrow, supra note 8, at 1306–11.
Corpus of Contemporary American English: Texts, https://www.english-corpora.org/coca/help/texts.asp [https://perma.cc/75N8-7V2X] (last visited Oct. 13, 2025).
See Inbal Arnon & Neal Snider, More Than Words: Frequency Effects for Multi-Word Phrases, 62 J. Memory & Language 67, 79 (2010) (concluding that the authors’ “meta-analysis showed a direct relation between frequency of occurrence and processing latencies: the more often a [four-word] phrase has been experienced, the faster it was processed”).
Cf. Xiaobin Chen & Detmar Meurers, Word Frequency and Readability: Predicting the Text-Level Readability with a Lexical-Level Attribute, 41 J. Rsch. Reading 486, 490 (2018) (“Although these corpora were carefully constructed from materials that students read in their daily life, they failed to represent the also important, if not more important, source of spoken language that students are exposed to. The amount of exposure from spoken language is much greater than from written ones. Failure to include the spoken language does great harm to the representativeness of the frequency list and to its predictive power for text readability.”).
Kyle, supra note 117, at 57.
David Caplan & Gloria S. Waters, Verbal Working Memory and Sentence Comprehension, 22 Behav. & Brain Scis. 77, 78–79 (1999) (summarizing research and noting, “The trouble that normal English users have understanding [a complex sentence] is thought to arise because they do not have sufficient working memory to retain the intermediate products of computation that are produced in building the complex syntactic structure of this sentence”).
Charrow & Charrow, supra note 8, at 1327–28.
Khanna & Cortese, supra note 148, at 623–24.
Id.
Michael Wilson, MRC Psycholinguistic Database: Machine-Usable Dictionary, Version 2.00, 20 Behav. Rsch. Methods, Instruments, & Computs. 6, 7 (1988).
Max Coltheart, The MRC Psycholinguistic Database, 33A Quarterly J. Experimental Psych. 497 (1981).
MRC Psycholinguistic Database, supra note 151.
There are 169 function words (i.e., words that are classified as “other,” as opposed to “noun,” “verb,” or “adjective”) with concreteness rating in the MRC Psycholinguistic Database.
See Sidney J. Segalowitz & Korri C. Lane, Lexical Access of Function versus Content Words, 75 Brain & Language 376, 376 (2000).
Khanna & Cortese, supra note 148, at 623–24.
Crossley et al., supra note 45, at 553 tbl. 3.
Id. at 553 tbl. 2.
“Tokenizing” is the process of dividing a text into its component words (word tokenization) and sentences (sentence tokenization)—essentially identifying the boundaries between words, and between sentences. “Tagging” is the process of assigning part-of-speech labels to particular words (e.g., recognizing that “banana” is a noun, and “jumping” is a verb). “Parsing” is the process of identifying how words in a phrase or sentence relate to one another grammatically or syntactically. For an overview of these processes, see Dev Shah, Breaking Down Natural Language Processing, Medium (July 27, 2022), https://devshahs.medium.com/breaking-down-natural-language-processing-7bd8b8b02f95 [https://perma.cc/D7UE-GVDS].
This is true of the TAASSC software tool that I have used for the purposes of computing a MADRS variable score, based on my experimentation with the software. By changing the content of a text file to add or delete periods that denote abbreviations (while leaving all other file content the same), for instance, I created files that scored slightly differently on many of the syntax measures computed by TAASSC.
The variables that contribute to this formula, as calculated by the ARTE software tool, are explained within the ARTE Index Description Sheet, Rows 54–57, https://docs.google.com/spreadsheets/d/1O2SOCTcUYEpKzRGLC_iVRcrRwY4uefDbdpb0V-40rF0 (last visited Oct. 13, 2025).
See McNamara et al., supra note 132, at 27–36.
Id. at 27 (citation omitted).
Id. at 32.
See supra Part IV.D.1.
All concreteness scores in this table are taken from the Medical Research Council’s Concreteness ratings within its Psycholinguistic Database, for words that I identified as being function words. See MRC Psycholinguistic Database, supra note 151.
See Mike Madden, MADRS_Madden_SCCResults V1, Harvard Dataverse (Aug. 22, 2024), https://dataverse.harvard.edu/dataset.xhtml?persistentId=doi:10.7910/DVN/G0ENLS [https://doi.org/10.7910/DVN/G0ENLS].
Off. of the Comm’r for Fed. Jud. Affs. Can., The Honourable Malcolm Rowe’s Questionnaire, Part 10, Question 4 (July 4, 2017) (emphasis added), https://www.fja-cmf.gc.ca/scc-csc/2016-MalcolmRowe/nominee-candidat-eng.html [https://perma.cc/UV73-QTKT].
Id.
Kasirer Questionnaire, supra note 19, at Part 10, Question 4.
Id.
Jamal Questionnaire, supra note 19, at Part 10, Question 4.
Id.
Kasirer Questionnaire, supra note 19, at Part 10, Question 4; Jamal Questionnaire, supra note 19, at Part 10, Question 4.
Portions of Justice Martin’s full answer about her public audience are reproduced here:
Through its decisions, the Supreme Court speaks to the people on matters that lie at the heart of what it means to live in a constitutional democracy, at one end of the spectrum, to matters that lie at the heart of their day-to-day lives, at the other end.
Of course, the public is always an important audience for every court. This is because the legitimacy of judicial decision-making rests in large measure on people believing that our legal system delivers justice. Judges seek to encourage public confidence in the legal system and foster respect for the rule of law at all times. . . . As well, they promote transparency and accountability, and reduce the risk of error. In the age of information and internet research, the public enjoys ready access to judicial decisions. With on-line media reports on a case, there is frequently an express link to the full judgment of the court. This results in both a broader audience and a more informed public.
. . . .
. . . The decisions should be clear and convincing. Experience and research suggests that people are capable of respecting decisions, even ones they disagree with strongly, when the decision-making process is respectable, rational and legitimate.
The audience for any decision of the Supreme Court may vary slightly depending on the issues, area of law, and the parties and intervenors involved. What is constant is that many people are watching with great interest. There is also no competition between the above listed audiences. For example, decisions that provide a full explanation to the parties will also inform the wider public. In the end, the decisions of the Supreme Court must demand public respect. It is the way judges ensure public respect for, belief in and a commitment to the rule of law.
Off. of the Comm’r for Fed. Jud. Affs. Can., The Honourable Sheilah Martin’s Questionnaire, Part 10, Question 4 (Dec. 21, 2017), https://www.fja.gc.ca/scc-csc/2017-SheilahMartin/nominee-candidat-eng.html [https://perma.cc/YS2D-L4M4].
Statistics Canada, Table 98-10-0384-01: Highest level of education by census year: Canada, provinces and territories, census metropolitan areas and census agglomerations (Dec. 9, 2022), https://www150.statcan.gc.ca/t1/tbl1/en/tv.action?pid=9810038401 [https://doi.org/10.25318/9810038401-eng].
See generally Jean Louis Goutal, Characteristics of Judicial Style in France, Britain and the U.S.A., 24 Am. J. Comp. Law 43 (1976) (exploring the hypothesis that there is a clear relationship between the origins of a country’s legal system, on the one hand, and the ways in which judges write their decisions, on the other hand).